
Update: Both DebugView and StreamView are available to all Firebase developers, so you can get access to your data a whole lot faster! Happy Analytics viewing!
This is probably one of the most common questions we get around Firebase Analytics, and we thought it was worth taking some time to delve into this topic a little deeper. So buckle in, kids! We’ve got some learning ahead of us…
To understand latency with Firebase Analytics, there are two potential delays you need to be aware of:
- The time it takes for analytics data on the client to be sent over to the Firebase Analytics servers.
- The time it takes for Firebase Analytics data to be displayed to you in the Firebase console once it’s been received on the server.
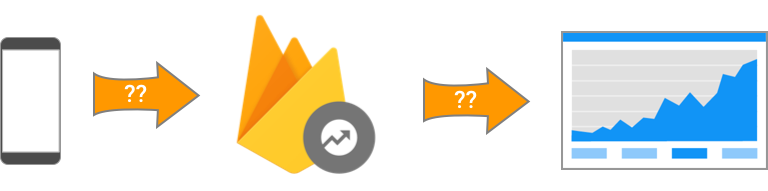
Let’s go over these one at a time.
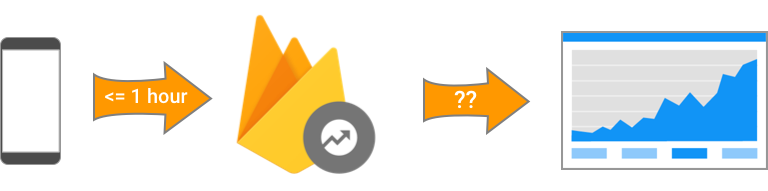
Client-to-server latency
Firebase Analytics doesn’t constantly stream down data from the client device. That would be a serious battery drain, and we want to be respectful of your users’ battery life. Instead, analytics data is batched up and sent down when the client library sees that there’s any local data that’s an hour old.
On iOS devices (and Android devices without Google Play Services), this one hour timer is per app. But on Android devices with Play Services, this one hour timer is across all apps using Firebase Analytics.
In addition, Firebase Analytics will send down all of its data from the client if your user triggers a conversion event (like making an in-app purchase). And on iOS devices, Firebase Analytics will also send down its data whenever your app goes into the background.
“Hang on there — once an hour? What about my users who churn out sooner than that?”
Not to worry. On most Android devices, it’s Google Play Services that manages sending down this data. Which means that even if your user deletes your app after an hour, that data will still get sent down because Google Play Services still has it.
On iOS devices, Firebase will also send down data when your app moves into the background. So if a user tries your app for 20 minutes and then uninstalls it, that session data will still be received, because your app will have sent down the data the moment the user moved your app to the background. The one corner case where analytics data would actually get lost on iOS would be if your app crashed and then your user immediately uninstalled it.
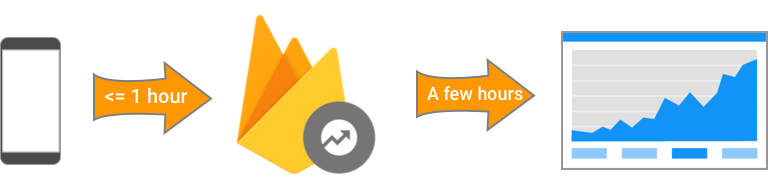
Server-to-console latency
Now, moving on to the second case, there’s also the frequency at which Firebase Analytics grabs the latest batch of data it’s received from your client and uses that data to update the reports and graphs you see in the Firebase Console. This process typically runs every few hours. So that’s the kind of delay you should expect after your client data is sent down to the server.
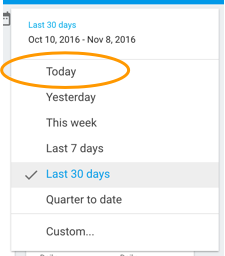
If you’re looking for your most recent data in these reports, keep in mind that the default “Last 30 days” report doesn’t include any data from the current day — this is because the data for the current day is incomplete, and it would be misleading (not to mention a bummer) to see every graph end with a giant downturn in usage. So if you want to see the current day’s data, you’ll want to select “Today” from the drop down menu in the Firebase Console.
On the other hand, if you’ve set up your app to export all of its Firebase analytics data to BigQuery, this data is available for you to look at right away. There are no batch reports that need to be run, so you can immediately view all of the day’s data by looking at the app_events_intraday table that’s automatically created for you in BigQuery. For more about this feature, be sure to check out our earlier blog post.
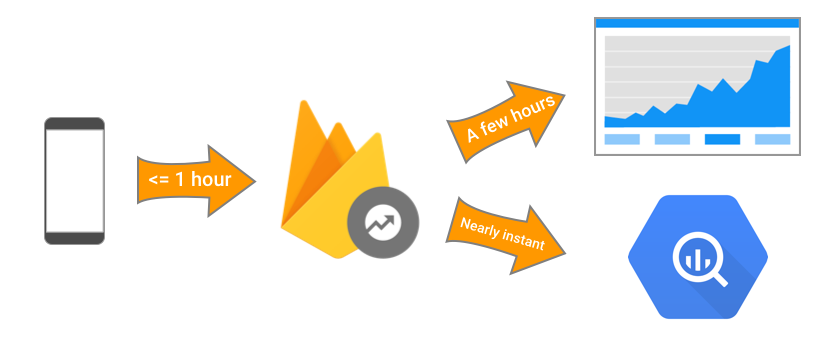
But outside of BigQuery, it generally takes a few hours for you to see any data you’ve recorded in Firebase Analytics.
**### “Anything that can be done to speed up this process?” **
As you may have heard at our Firebase Dev Summit, we’ve working on two enhancements to Firebase Analytics — DebugView and StreamView — which will give you more up-to-date insight into your analytics data during both development and production.
Neither of these are yet available to the general public, but as your reward for making it this far into the blog post, here’s a link to sign up for the DebugView closed beta. See? Reading has its advantages!
“So, what if I want a some kind of realtime dashboard? What should I do?”
There are many developers out there who want to be notified as soon as they see something unusual in their stats — whether that’s a sudden drop in in-app purchases, people failing to make it through the tutorial, or what-have-you.
And while you can’t quite accomplish this with the free Firebase Analytics reports that you see in the console, you could accomplish this sort of thing by combining BigQuery with another tool such as Google Data Studio, a third-party visualization tool like Tableau, or even writing your own Google Apps Script monitoring script. All of which allow you to run some pretty sophisticated custom reports, but frankly, that’s a whole other blog post.
Do keep in mind, however, that you’re still subject to BigQuery usage charges when you query your data though these tools if you go beyond the 1TB/month free tier, so be mindful of how much (and how frequently) you decide to process your data.
Hopefully, this gives you a better understanding of how long it takes for you to see analytics data and what you can expect when you’re developing your app. Now go forth and start recording those events!