
For many years, developers and app teams have relied on Crashlytics to improve their app stability. By now, you’re probably familiar with the main parts of the Crashlytics UI; perhaps you even glance at crash-free users, crash-free sessions, and the issues list multiple times a day (you wouldn’t be the only one!).

The tips
In this post, we want to share 7 pro-tips that will help you get even more value out of Crashlytics, which is now part of the new Fabric dashboard, so you can track, prioritize, and solve issues faster.
1. Speed up your troubleshooting by checking out crash insights
In July, we officially released crash insights out of beta. Crash insights helps you understand your crashes better by giving you more context and clarity on why those crashes occurred. When you see a green lightning bolt appear next to an issue in your issues list, click on it to see potential root causes and troubleshooting resources.
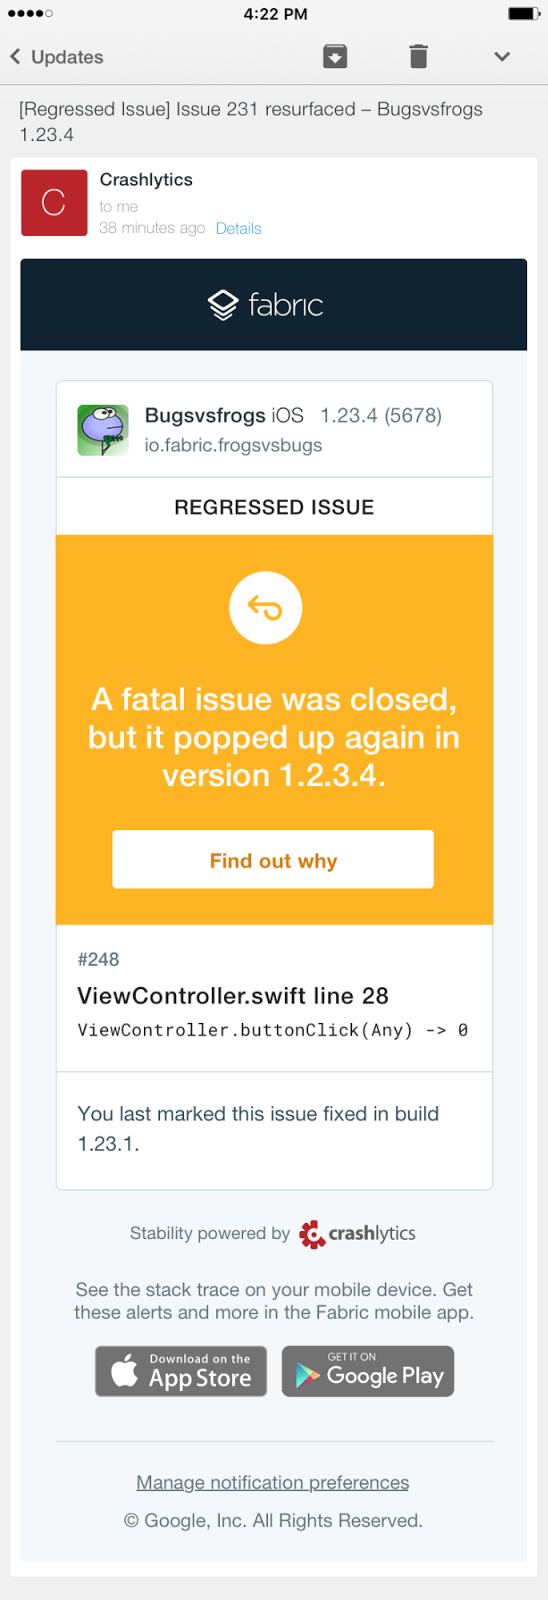
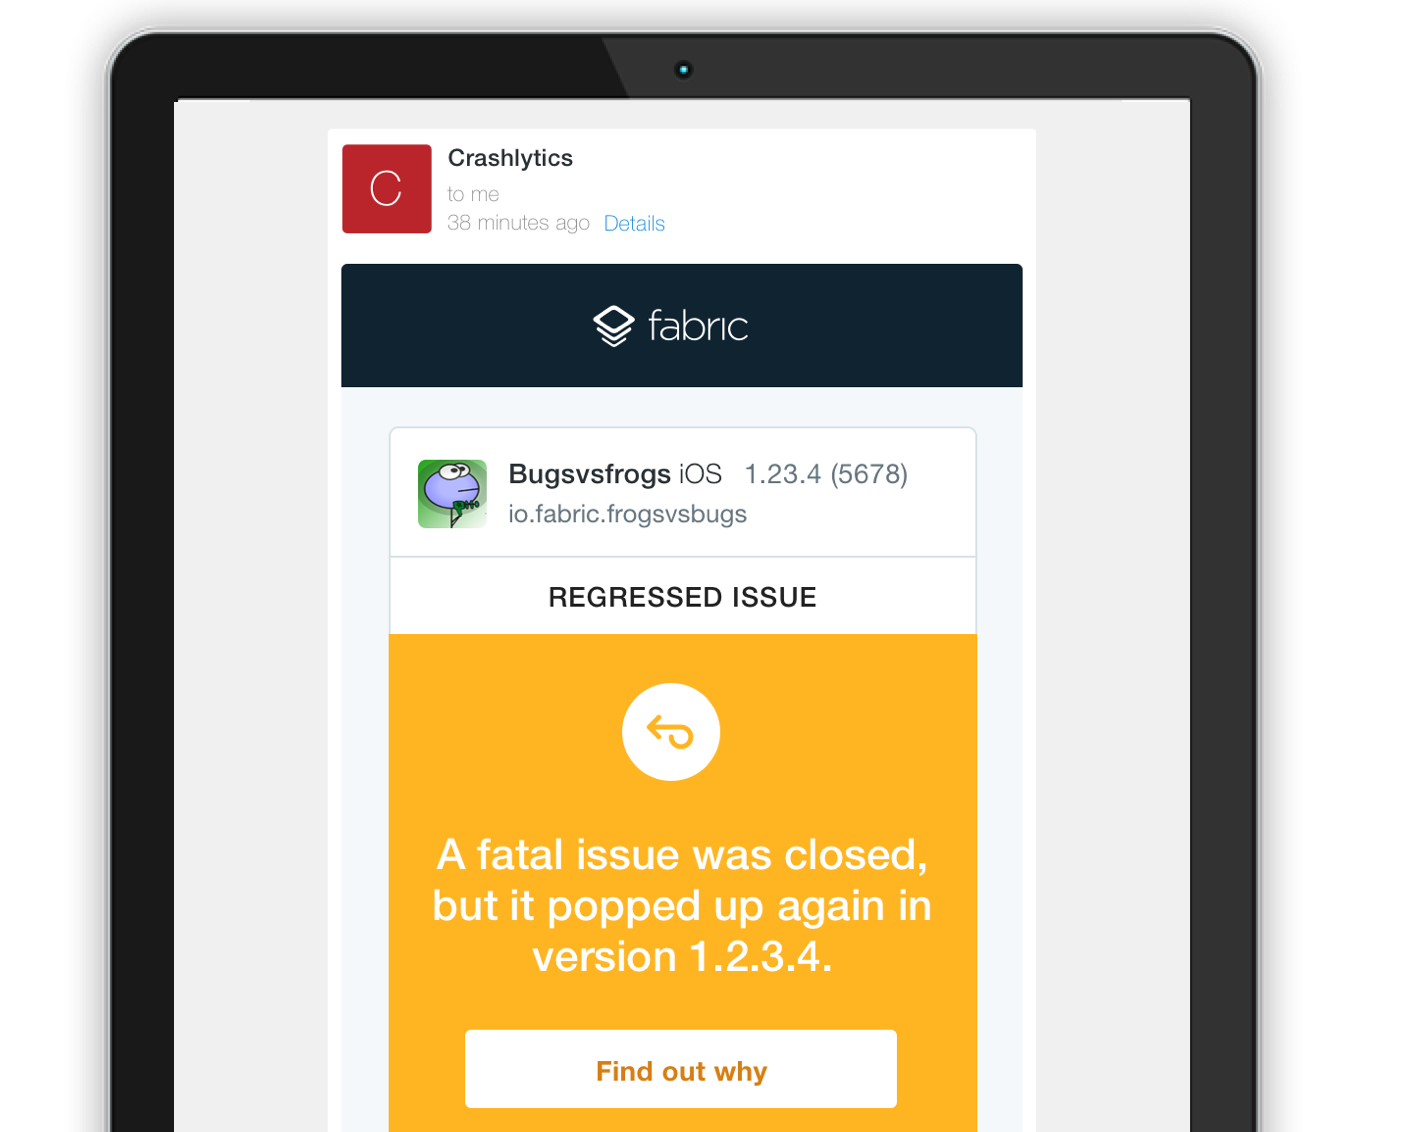
2. Mark resolved issues as “closed” to track regressions
Debugging and troubleshooting crashes is time-consuming, hard work. As developers ourselves, we understand the urge to sign-off and return to more exciting tasks (like building new app features) as soon you resolve a pesky issue - but don’t forget to mark this issue as “closed” in Crashlytics! When you formally close out an issue, you get enhanced visibility into that issue’s lifecycle through regression detection. Regression detection alerts you when a previously closed issue reoccurs in a new app version, which is a signal that something else may be awry and you should pay close attention to it.
3. Close and lock issues you want to ignore and declutter your issue list
As a general rule of thumb, you should close issues so you can monitor regression. However, you can also close and lock issues that you don’t want to be notified about because you’re unlikely to fix or prioritize them. These could be low-impact, obscure bugs or issues that are beyond your control because the problem isn’t in your code. To keep these issues out of view and declutter your Crashlytics charts, you can close and lock them. By taking advantage of this “ignore functionality”, you can fine tune your stability page so only critical information that needs action bubbles up to the top.

4. Use wildcard builds as a shortcut for adding build versions manually
Sometimes, you may have multiple builds of the same version. These build versions start with the same number, but the tail end contains a unique identifier (such as 9.12 (123), 9.12 (124), 9.12 (125), etc). If you want to see crashes for all of these versions, don’t manually type them into the search bar. Instead, use a wildcard to group similar versions together much faster. You can do this by simply adding a star (aka. an asterisk) at the end of your version prefix (i.e. 9.12*). For example, if you use APK Splits on Android, a wildcard build will quickly show you crashes for the combined set of builds.
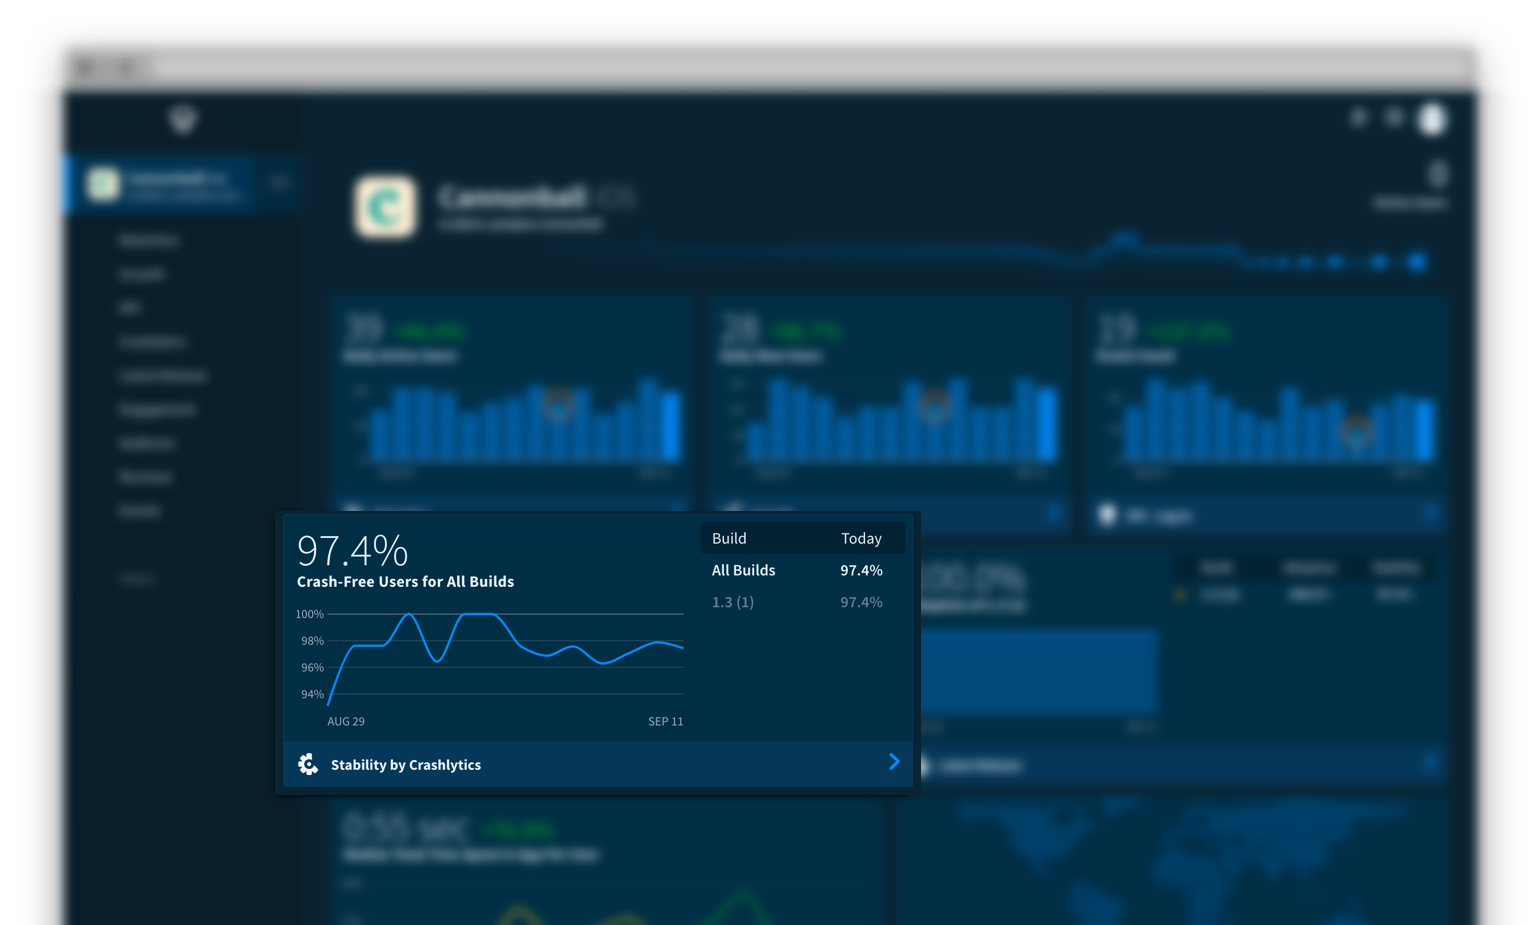
5. Pin your most important builds to keep them front and center
As a developer, you probably deploy a handful of builds each day. As a development team, that number can shoot up to tens or hundreds of builds. The speed and agility with which mobile teams ship is impressive and awesome. But you know what’s not awesome? Wasting time having to comb through your numerous builds to find the one (or two, or three, etc.) that matter the most. That’s why Crashlytics allows you to “pin” key builds so that they appear at the top of your builds list. Pinned builds allow you to find your most important builds faster and keep them front and center, for as long as you need. Plus, this feature makes it easier to collaborate with your teammates on fixing crashes because pinned builds will automatically appear at the top of their builds list too.
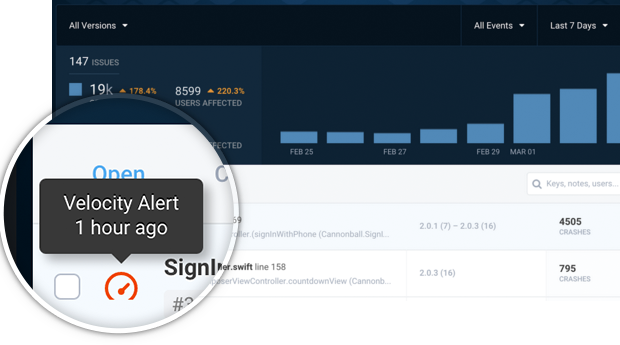
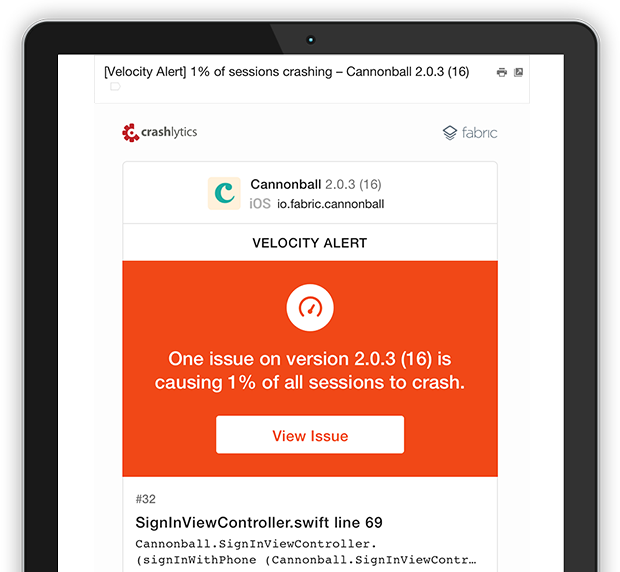
6. Pay attention to velocity alerts to stay informed about critical stability issues
Stability issues can pop up anytime - even when you’re away from your workstation. Crashlytics intelligently monitors your builds to check if one issue has caused a statistically significant number of crashes. If so, we’ll let you know if you need to ship a hot fix of your app via a velocity alert. Velocity alerts are proactive alerts that appear right in your crash reporting dashboard when an issue suddenly increases in severity or impact. We’ll send you an email too, but you should also install the Fabric mobile app, which will send you a push notification so you can stay in the loop even on the go. Keep an eye out for velocity alerts and you’ll never miss a critical crash, no matter where you are!
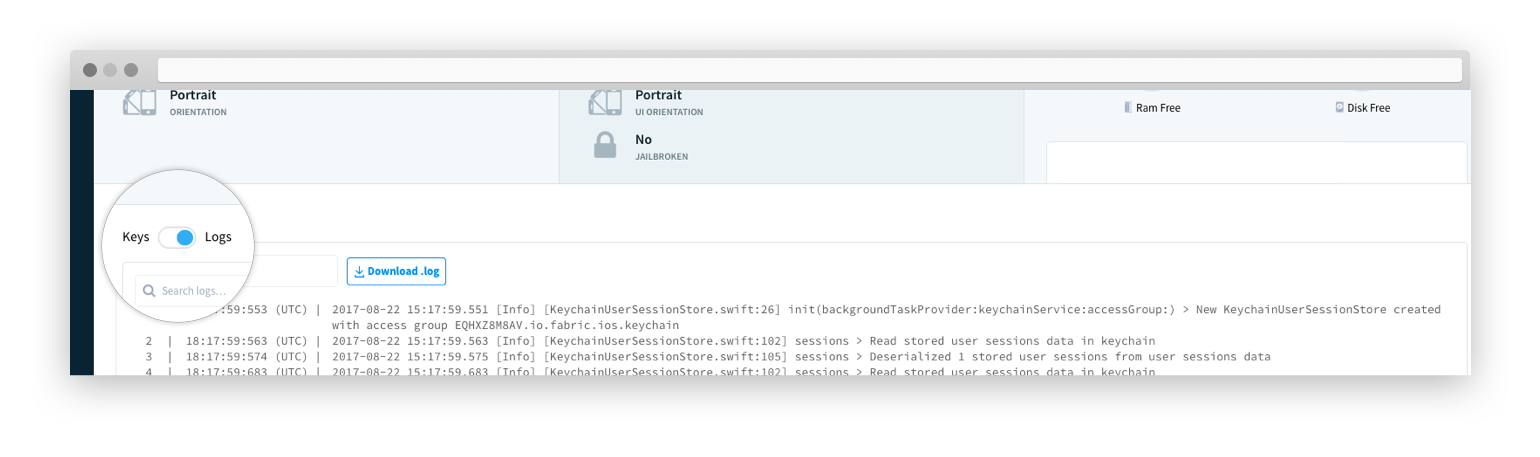
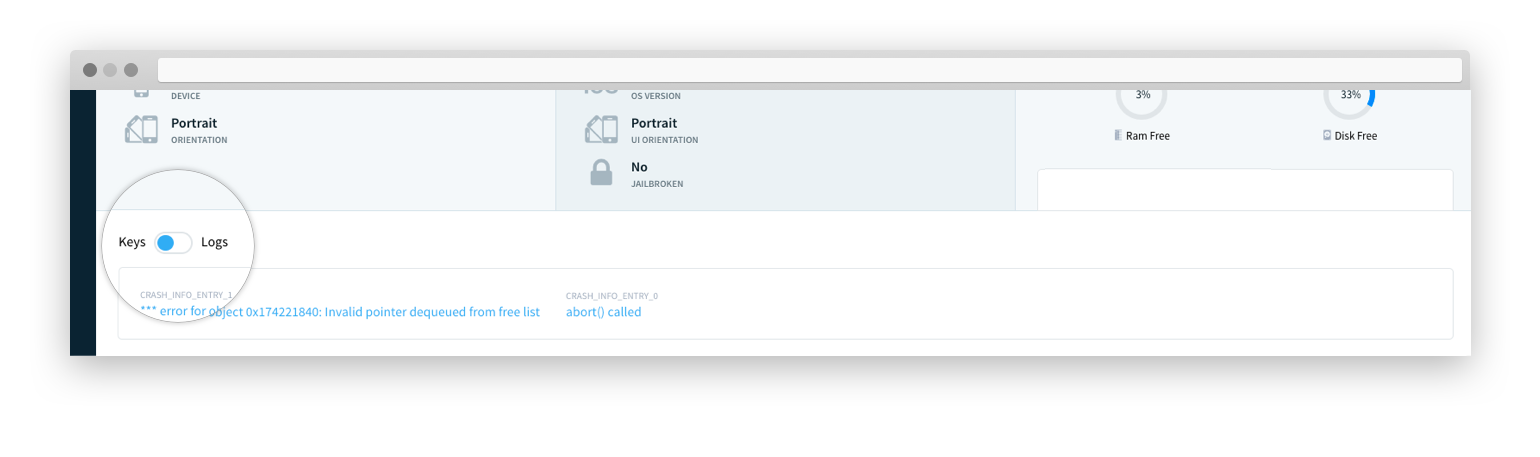
7. Use logs, keys, and non-fatals in the right scenarios
The Crashlytics SDK lets you instrument logs, keys, non-fatals, and custom events, which provide additional information and context on why a crash occurred and what happened leading up to it. However, logs, keys, non-fatals, and custom events are designed to track different things so let’s review the right way to use them.
Logs: You should instrument logs to gather important information about user activity before a crash. This could be user behavior (ex. user went to download screen, clicked on download button) to details about the user’s action (ex. image downloaded, image downloaded from). Basically, logs are breadcrumbs that show you what happened prior to a crash. When a crash occurs, we take the contents of the log and attach it to the crash to help you debug faster. Here are instructions for instrumenting logs for iOS, Android, and Unity apps.
Keys: Keys are key value pairs, which provide a snapshot of information at one point in time. Unlike logs, which record a timeline of activity, keys record the last known value and change over time. Since keys are overwritten, you should use keys for something that you would only want the last known value for. For example, use keys to track the last level a user completed, the last step a user completed in a wizard, what image the user looked at last, and what the last custom settings configuration was. Keys are also helpful in providing a summary or “roll-up” of information. For instance, if your log shows “login, retry, retry, retry” your key would show “retry count: 3.” To set up keys, follow these instructions for iOS, Android, and Unity apps.
Non-fatals: While Crashlytics captures crashes automatically, you can also record non-fatal events. Non-fatal events mean that your app is experiencing an error, but not actually crashing.
For example, a good scenario to log a non-fatal is if your app has deep links, but fails to navigate to them. A broken link isn’t something that will necessarily crash your app, but it’s something you’d want to track so you can fix the link. A bad scenario to log a non-fatal is if an image fails to load in your app due to a network failure because this isn’t actionable or specific.
You should set up non-fatal events for something you want the stack trace for so you can triage and troubleshoot the issue.
If you simply want to count the number of times something happens (and don’t need the stack trace), we’d recommend checking out custom events.
That’s all!
These 7 tips will help you get the most out of Crashlytics. If you have other pro-tips that have helped you improve your app stability with Crashlytics, tweet them at us! We can’t wait to learn more about how you use Crashlytics.