
Last year at Firebase Summit, we introduced you to Predictions, a machine learning product that helps you smartly segment your users based on their predicted future behavior. Without requiring anyone on your app team to have ML expertise, Predictions gives you insight into which segments of users are likely to churn or spend (or complete another conversion event) so you can make informed product decisions and grow your app.
As of today, Predictions makes more than 6 billion predictions per day for our developers and allows them to take meaningful actions by making predictive segments available for targeting in Remote Config, Cloud Messaging, In-App Messaging, and A/B Testing.
This year at Firebase Summit, we announced that Predictions has graduated out of beta and into general availability with a host of new features that we added based on your feedback.
Features
Increased insight into prediction stability
Since Predictions continuously update based on actual user behavior inside your app, we heard from many of you that you wanted to know how stable a prediction was before you integrate it into your app.
To help answer this question, we created a health indicator at the bottom of each predictive segment card that gives you a snapshot of how a certain prediction is performing:
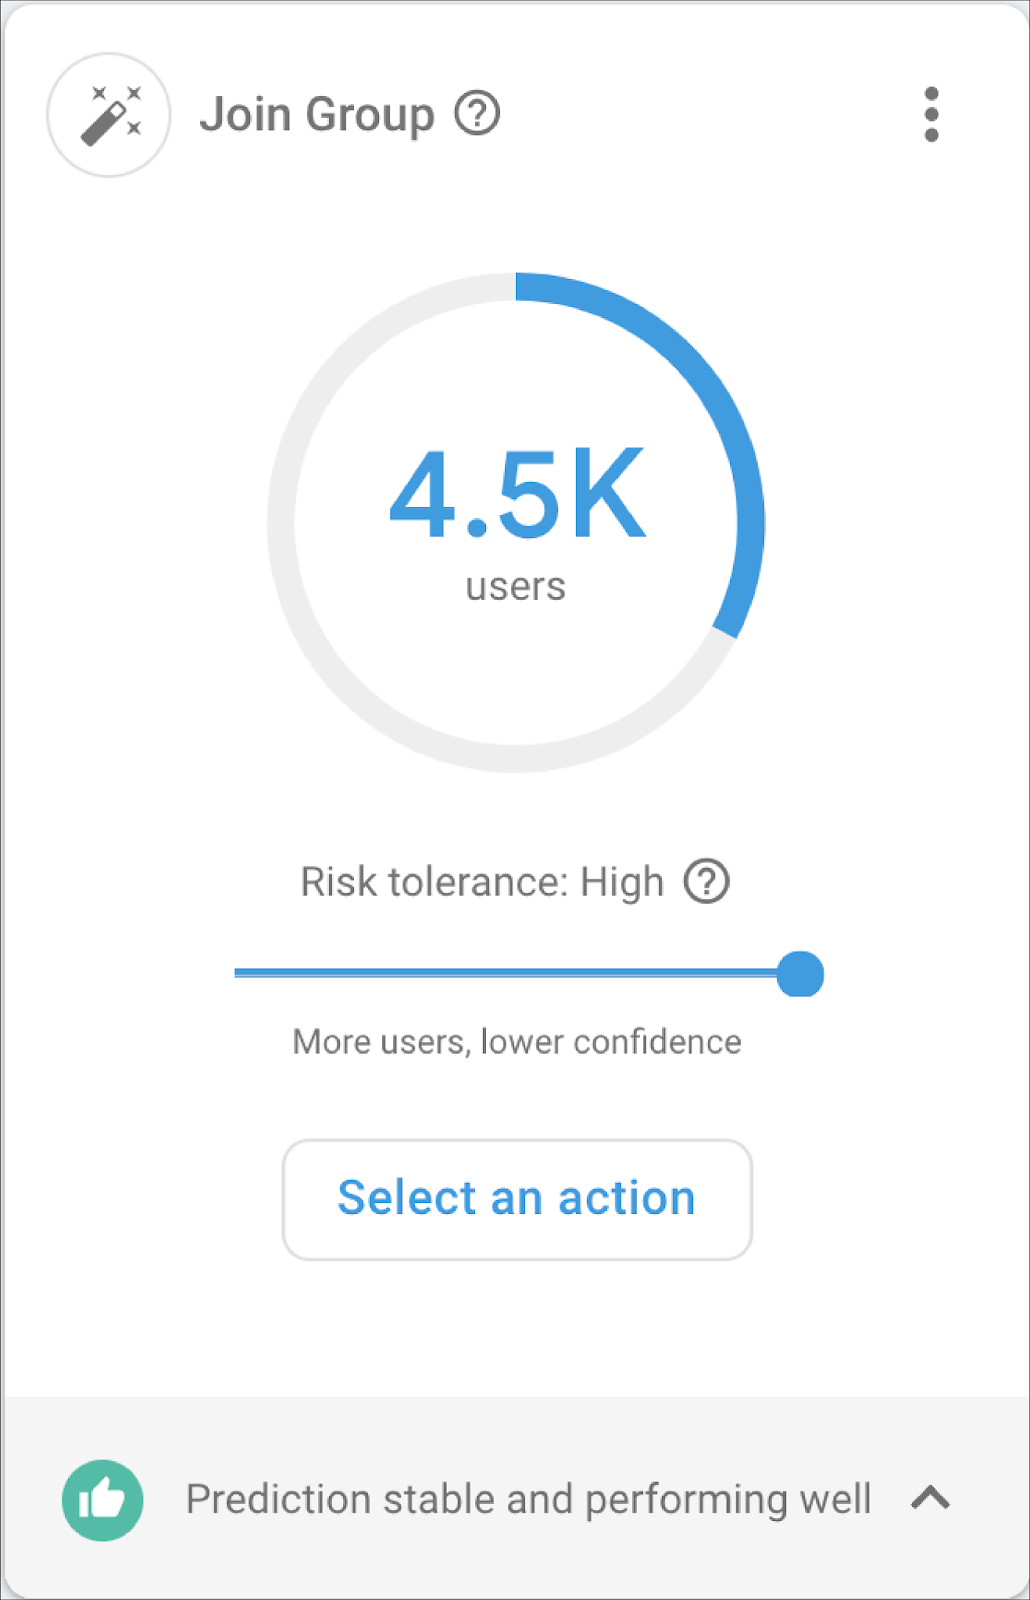 ](
](Green means it has been performing consistently well over the last two weeks

Yellow means it is performing well today but did not meet the quality threshold some time in the past two weeks
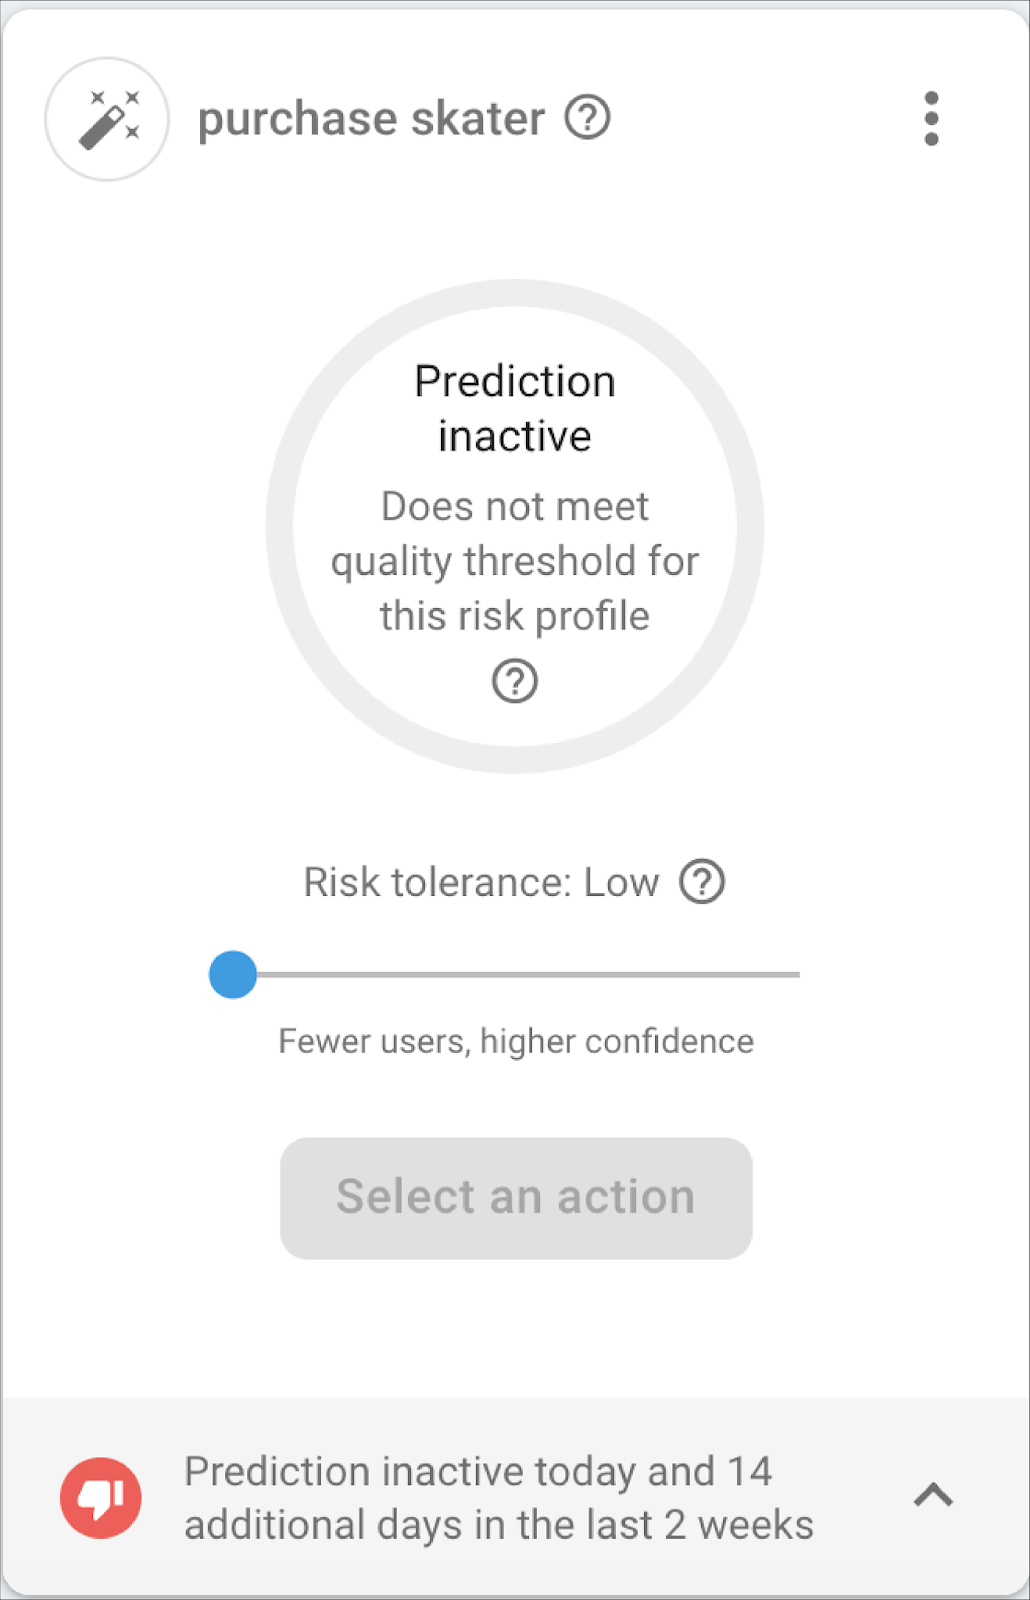 ](
](Red means it is not performing well today and had other performance issues over the last two weeks
It is worth mentioning that actions targeted with Predictions have a fail-safe mechanism, so if a predictive segment is performing poorly, it simply turns inactive. That means, if you are using Remote Config to deliver a set of values to users in that predicted group, Remote Config will gracefully fall back to your default values if the predictive segment decreases in reliability. Any notifications or in-app messages directed at that predictive segment will also not trigger until the predictive segment increases in accuracy.
Understand prediction health and quality
To help you understand how we assess the quality of a prediction, we are now exposing our evaluation criteria. For every predictive segment, we use a portion of your historical data from the last 28 days that we hold out during the model training phase.
We then compare the results of the prediction to what actually happened. This gives us two ways to score the prediction: how many of the users in the predictive segment actually behaved in the predicted way (we call that true positive rate) and how many users in the predictive segment were incorrectly classified (or in more technical terms, the false positive rate).
You can access this data from the bottom of the prediction card


Tapping on the health indicator exposes these values.
By exposing these two scores to you, you can now make a better determination about which risk profile to choose for your action.
New predictions details page
Another common question we received during our beta phase is what went into creating a predictive segment. We now offer a details page that gives you the ingredient list! You can click through and see what data our model makes use of. This includes event frequency, volume, and parameters as well as other data like device language, freshness of app install and more.

The last thing we are excited to announce is that now, you can export your raw predictions data into BigQuery. This will give you access to the raw prediction score, the thresholds we used for each risk profile, as well as the final result. You can use this data to create your own risk profiles or if you supply your own user_id property in analytics, to do sophisticated analysis with your analytics data. For example, you can find out which countries exhibit the highest potential to churn or spend!
We are humbled to have gained your trust over the past year and hope these improvements make it easier for you to make the most out of Predictions in your mobile apps and games. As always, if you have any questions, you can find us on Twitter (@firebase) and on Stack Overflow.
We are humbled to have gained your trust over the past year and hope these improvements make it easier for you to make the most out of Predictions in your mobile apps and games. As always, if you have any questions, you can find us on Twitter (@firebase) and on Stack Overflow.
Check out the docs
For more information on these updates, check out our docs below!