

As we build Crashlytics and talk to our developers, we’ve found that the way they use our dashboards is often nuanced and specific to their team. We’ve done our best to incorporate the themes we hear most often into the dashboard you see in the Firebase console, but one dashboard solution simply isn’t enough.
That’s why we launched the Crashlytics integration with BigQuery, giving you the freedom to deeply explore your data. And, using Data Studio (a free tool that sits on top of BigQuery), you can make custom dashboards from your Crashlytics data that fit the unique way your team works. Data Studio allows your team members who aren’t comfortable with SQL to easily work with the BigQuery data set. Data Studio dashboards are also easy to collaborate on and share, so your team can work more efficiently.
Today, we’re launching a Data Studio template that gives you a preview of what’s possible with Crashlytics and BigQuery. Let’s take a closer look at the template.
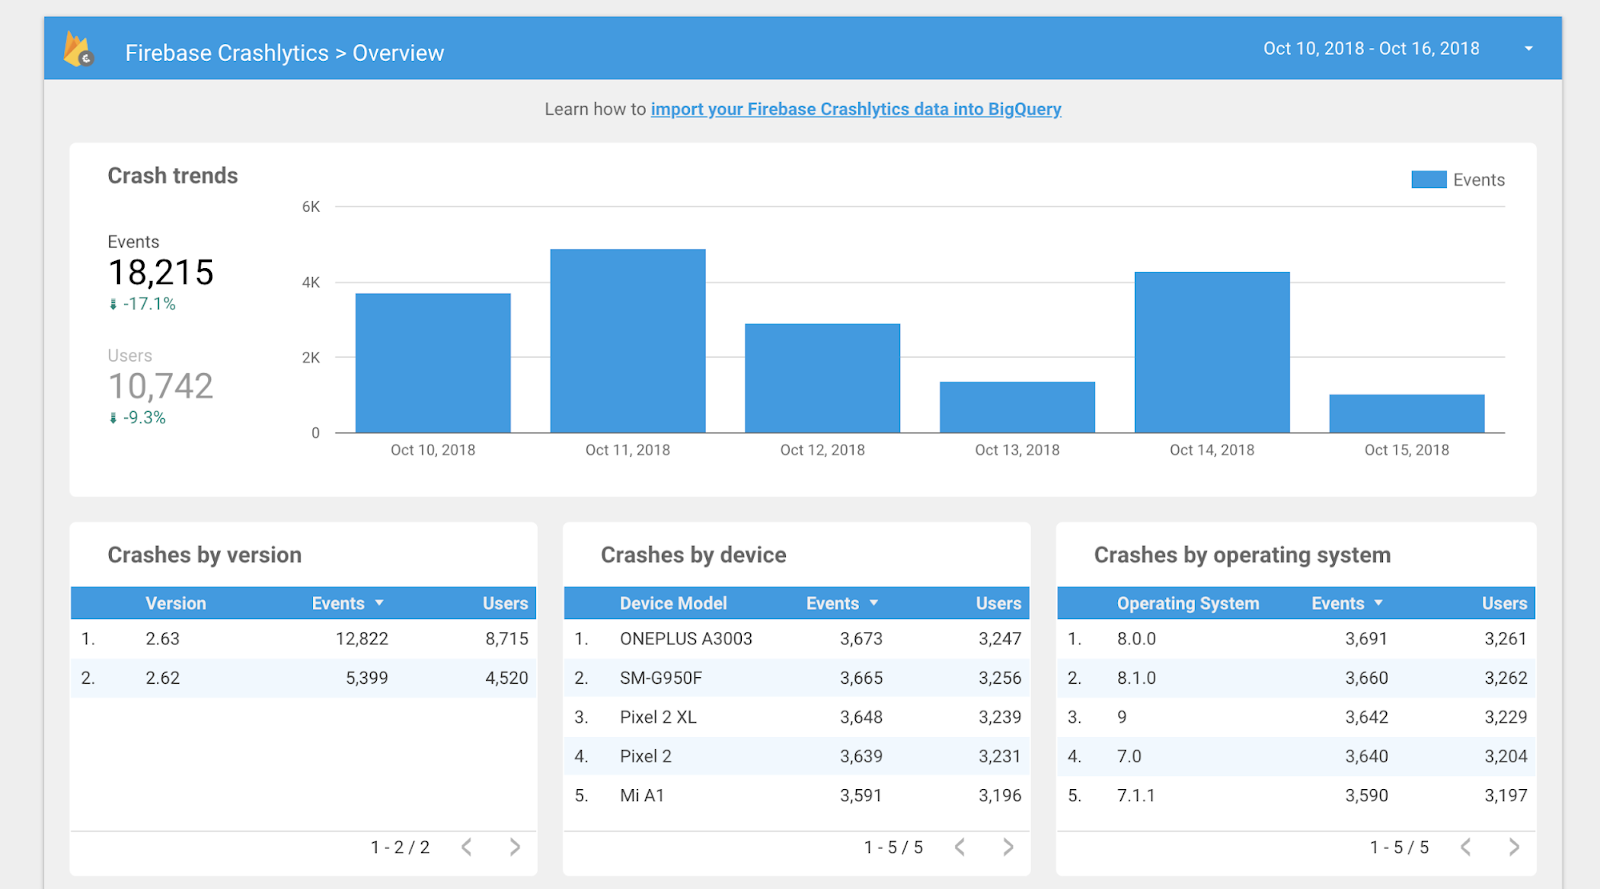
The overview section of our template provides an overview of which OS versions crash the most, which devices crash the most, and how it’s trending over time. You can customize each section to display the results of the exact queries you want and display how you need based on your business logic. If you want to keep an eye on the deprecation of an old operating system you can change or filter directly in the queries that back the dashboard.
Understand trends using custom keys
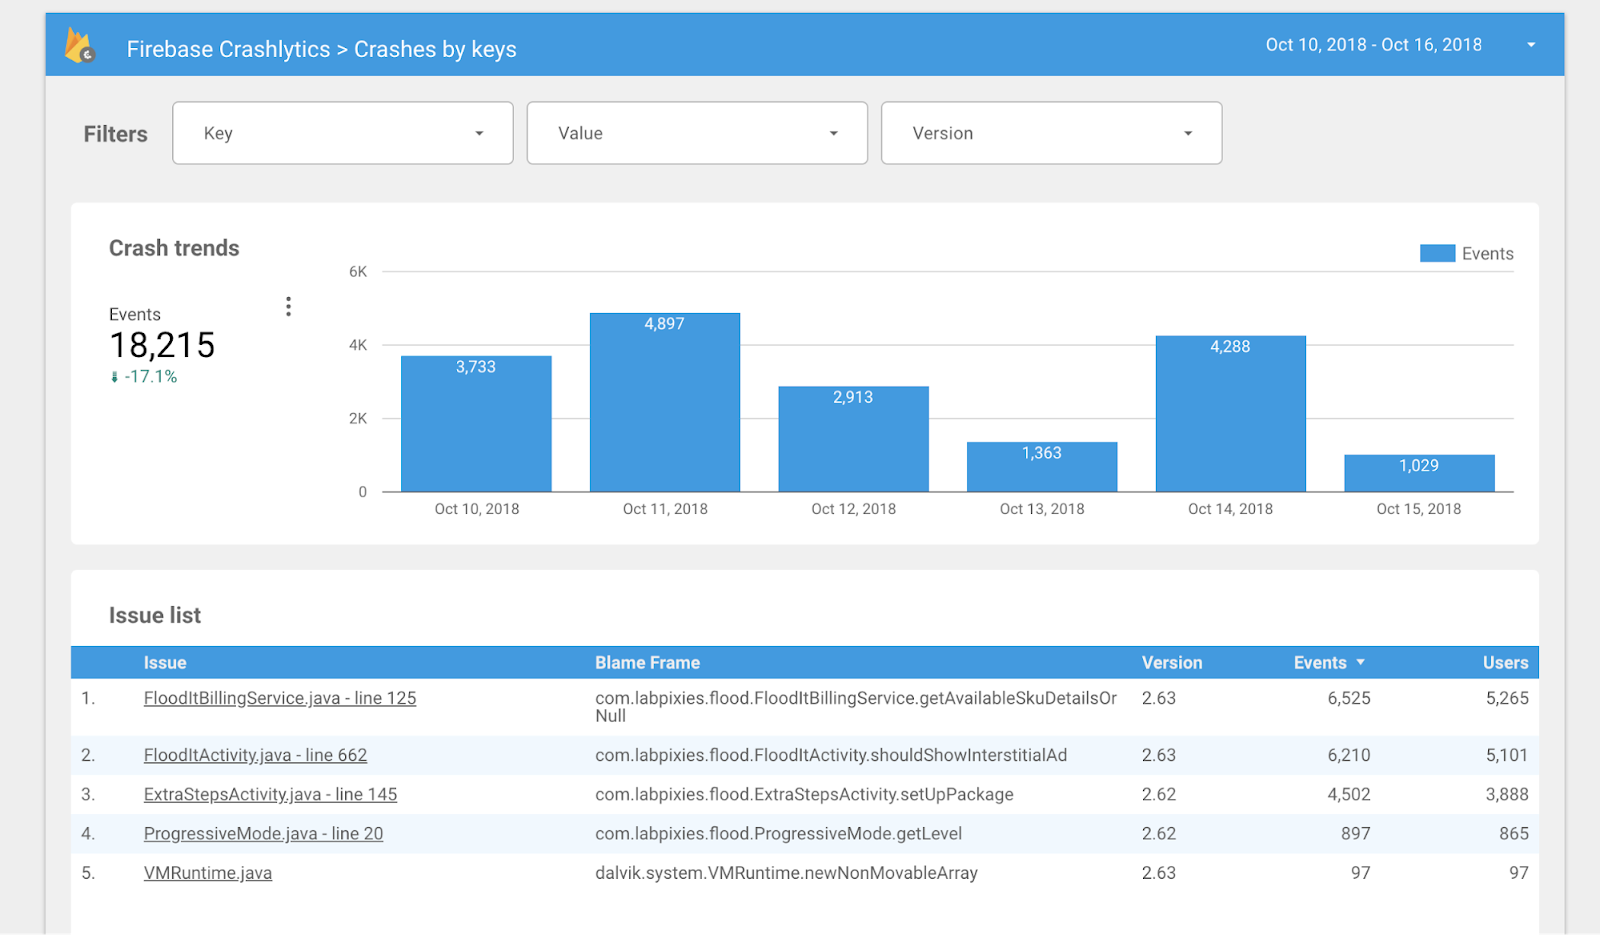
Up until now, exploring your crash reports by custom metadata like Experiment ID or an Analytics breadcrumb has been limited, making it tough to identify which variant in an experiment is least stable or which level in a game has the most crashes. Now, when you export your data to BigQuery, it’s easy to run any deep analysis you want, and then visualize your report with Data Studio or any other business system you use.
As an example, say that you set up your Android game so that you log what level a crash occurs with:
Crashlytics.setInt("current_level", 3);Now you can filter by the presence of a key and its values. We’ve created a sample dashboard for filtering these in our Data Studio template.
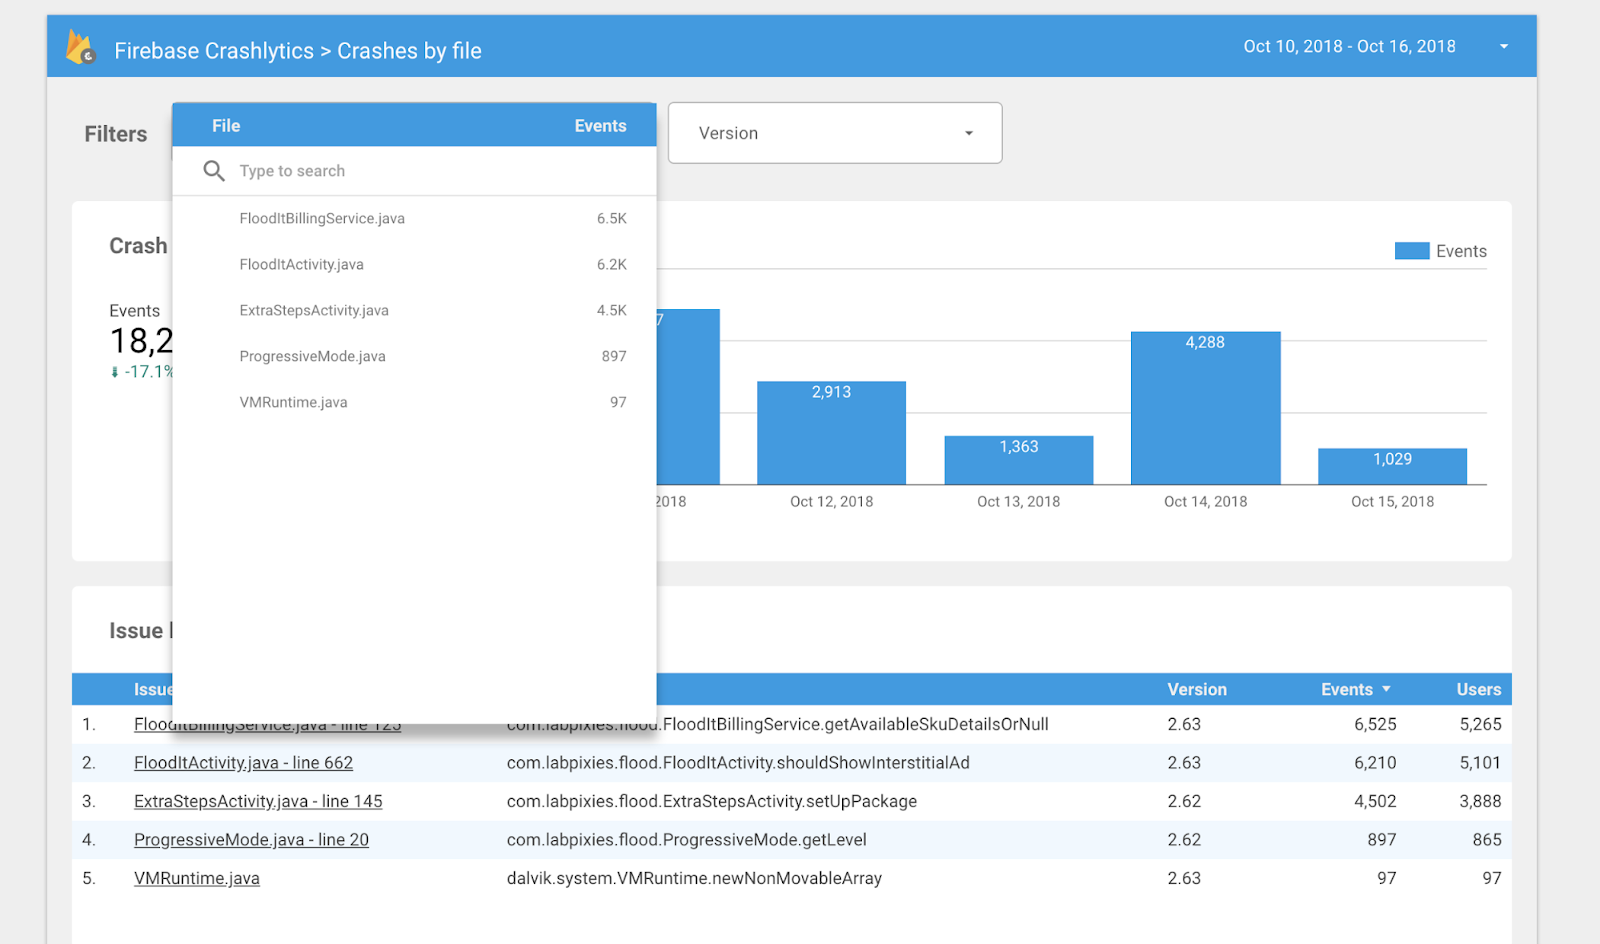
Know which areas of code are most impacted
We know our largest apps have different teams that specialize in specific areas of the code. For that, we’ve made it easy to filter by specific files in our Data Studio template.
Owning your experience
Our data studio template is totally customizable, meaning if you’d rather filter on a different part of our scheme or make more advanced tools, you can easily adapt based on your needs. You can adjust the template using the Data Studio UI or you can edit the backing BigQuery queries.
Your team can all work together by sharing the dashboard in DataStudio. This means team members don’t need to learn SQL to get the benefits of the Crashlytics integration with BigQuery.
You’ll also be able to select date ranges longer than 90 days, if you set up retention in BigQuery. The Crashlytics dashboard currently retains data for 90 days. With BigQuery you own the retention and deletion policies, making it much simpler for your team to track year-over-year trends in stability data. This means you’ll be able to customize your dashboard to display data over the exact period you are interested in.
Get started today
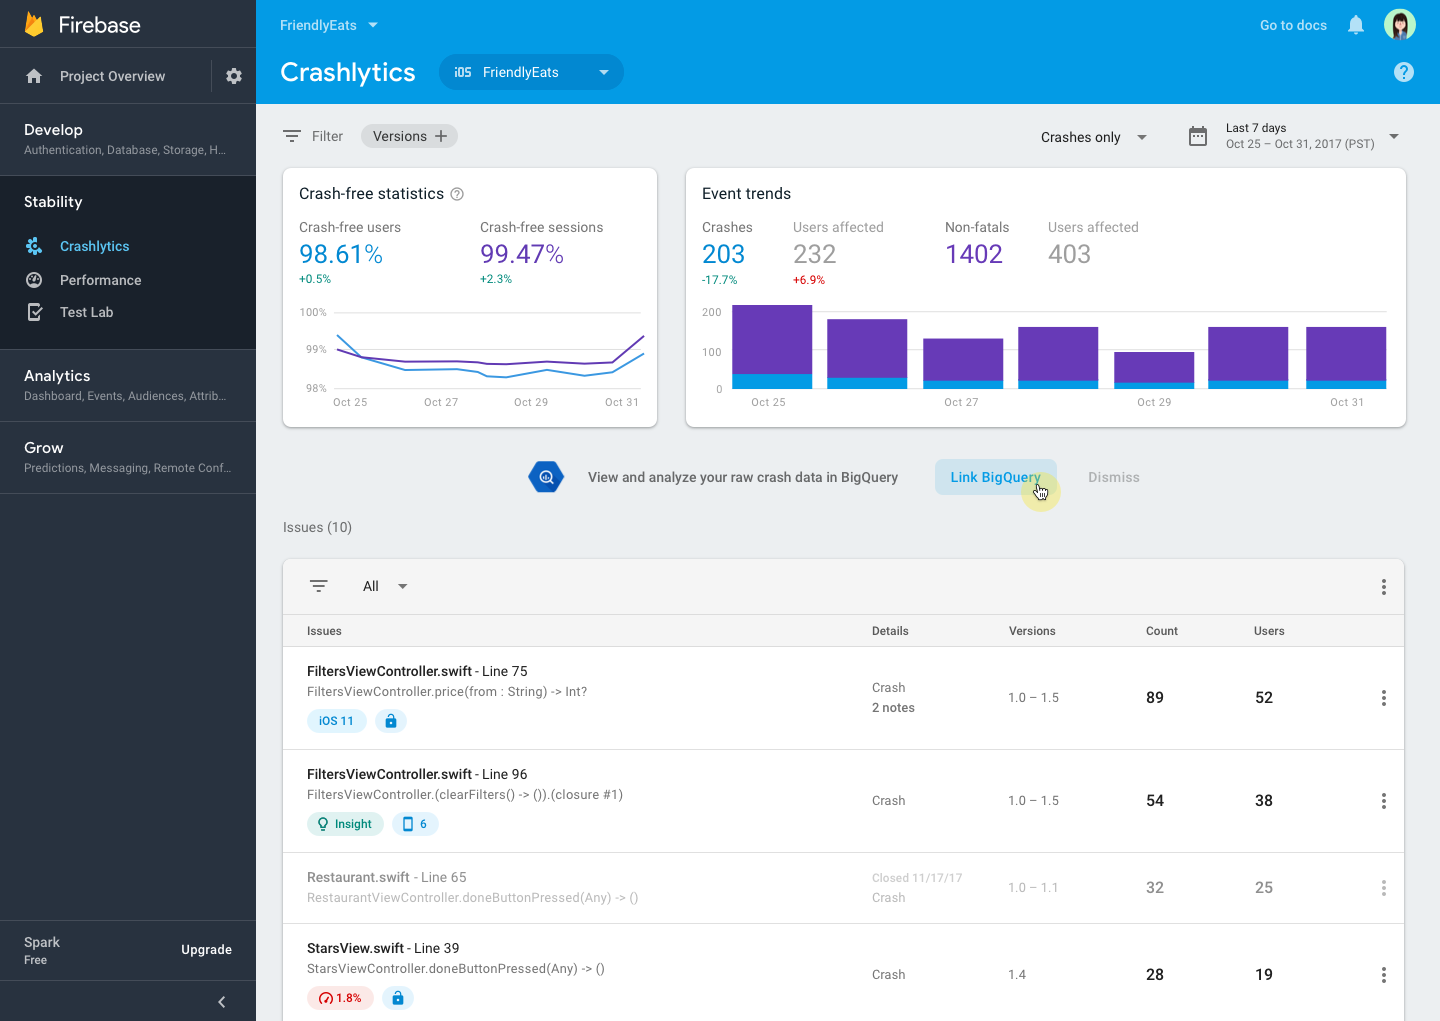
With just a few clicks from the Firebase Crashlytics dashboard you can enable daily exports of all raw crash data on a per-app or per-project basis. This includes your stack traces, logs, keys and any other crash data. You can also use the new BigQuery sandbox to get started for free.
Once you link to Crashlytics to BigQuery, follow these instructions to connect this template with your Crashlytics dataset.
If you are a current Fabric user, you can gain access to BigQuery export and all the other features of Firebase by linking your app in the Fabric dashboard. Check out this link for details and documentation.
We hope this improvement makes it even easier for you to dig into your crash reporting data and efficiently debug your app! As always, if you have any questions, you can find us on Twitter (@firebase) and on Stack Overflow. Happy debugging!