
In a competitive app ecosystem, making sure your app doesn’t crash frequently is integral to your app’s success. So with the graduation of Firebase Crashlytics SDK out of Beta, we think it’s a good time to highlight the benefits of integrating Crashlytics into your app. Read on for a refresher on the essential tools that Crashlytics provides to help you debug crashes and get the most out of your crash reports.
Reasons
1. Debug crashes faster with crash insights
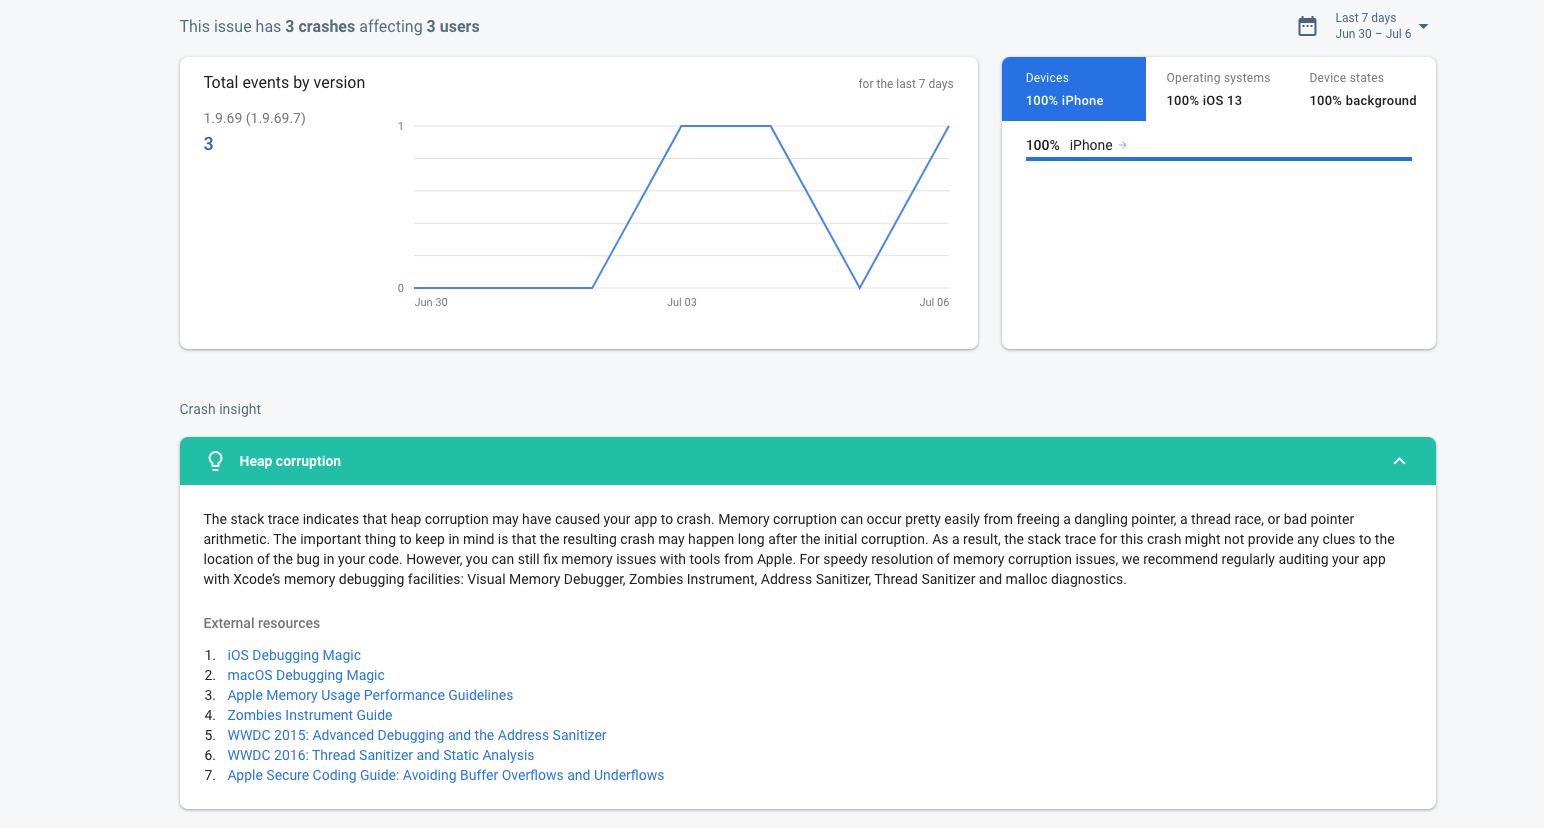
Even with access to crash reports, getting to the root cause of a crash can be pretty time consuming. Not only does the Crashlytics dashboard provide a holistic and clear view of what your users are experiencing, but you also get detailed suggestions on what could have caused a fatal error with crash insights.
Crash insights appear on your dashboard next to the crash report and provide additional context by highlighting potential root causes, such as SDK bugs and API misuse, that might be common across multiple apps. This serves as a starting point for investigation, which saves you time and speeds up your workflow.
2. Gain user insights with custom keys and logs
It can be frustrating to see a user run into a crash that you can’t seem to reproduce on your end. Crashlytics can help with this by allowing you to track the state and sequence of application usage prior to a crash through custom keys and custom logs. Custom keys provide a snapshot of information at one point in time, recording the last known value; custom logs record the events a user went through during their session.
For example, you might want to know how many items a user had in their shopping cart before a crash occurred. By naming a key using a string (e.g. “item purchase count”) and setting the value programmatically, Crashlytics uploads these key/values with the next crash. These keys and values are then visible right next to your stack trace.
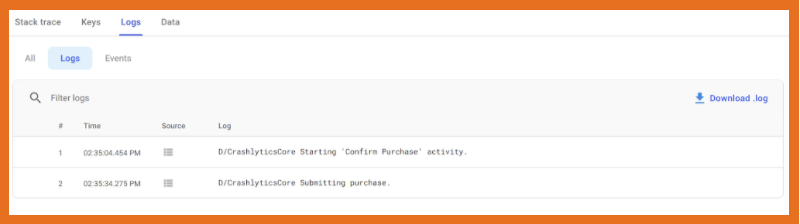
 ] Similar to custom keys, custom logs show up within a stack trace in your Crashlytics dashboard. All you need to do is call the Crashlytics logging function and provide your log string, and that custom log is then uploaded with the next crash. Now you can have your state and your logs all in one place.
3. Reproduce crashes faster with breadcrumbs powered by Google Analytics
Even with custom keys and logs, trying to manually capture every event your user triggers in your app can be daunting. However, if you integrate Crashlytics with Google Analytics, you can automatically capture predefined Google Analytics events, known as breadcrumbs. Breadcrumbs can further enhance the data captured with custom logs, giving you even more information on the cause of a crash.
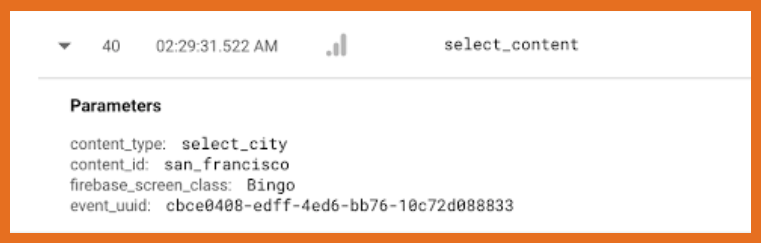
Just like custom logs and keys, breadcrumbs can be found within your stack trace in the Crashlytics dashboard, and will show the actions a user has taken prior to a crash, as well as the parameters within the event.
For instance, going back to the shopping cart example, breadcrumbs will capture event parameters like product ID, product name, type of currency used, quantity of items in the cart, etc. Here is a full list of the automatically collected events that Google Analytics breadcrumbs captures.
4. Receive notifications in real-time with Crashlytics alerts
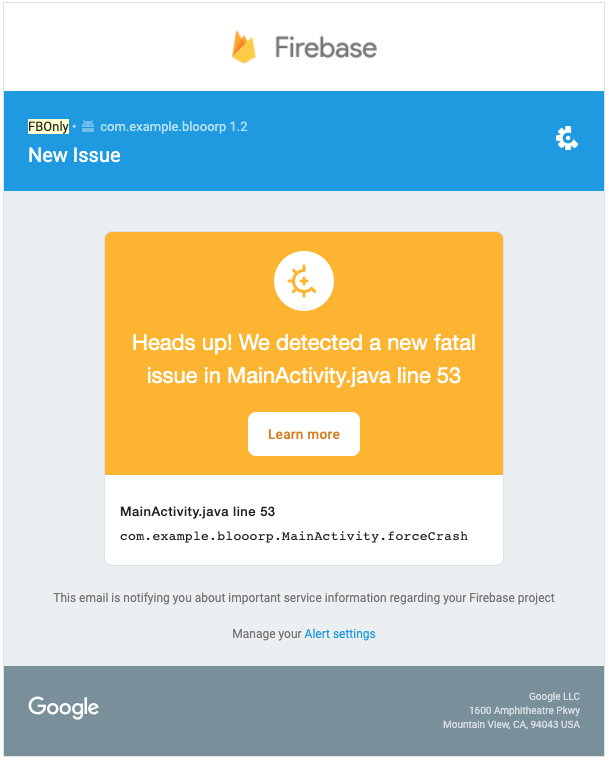
You never want to miss a critical user issue, but it can be tough to stay on top of crash reports around-the-clock. Using Crashlytics alerts, you can configure real-time alerts by three different levels of your app’s stability. Velocity alerts, considered high priority, are sent when an issue goes over a certain threshold within your user base. Regression alerts are sent when a previously closed issue has recurred in a new version of your app, typically medium priority. New issue alerts are sent when a new issue has occurred, and are generally low priority.
You can customize these alerts in the Crashlytics console, and receive them via Slack, PagerDuty, Jira, or email.
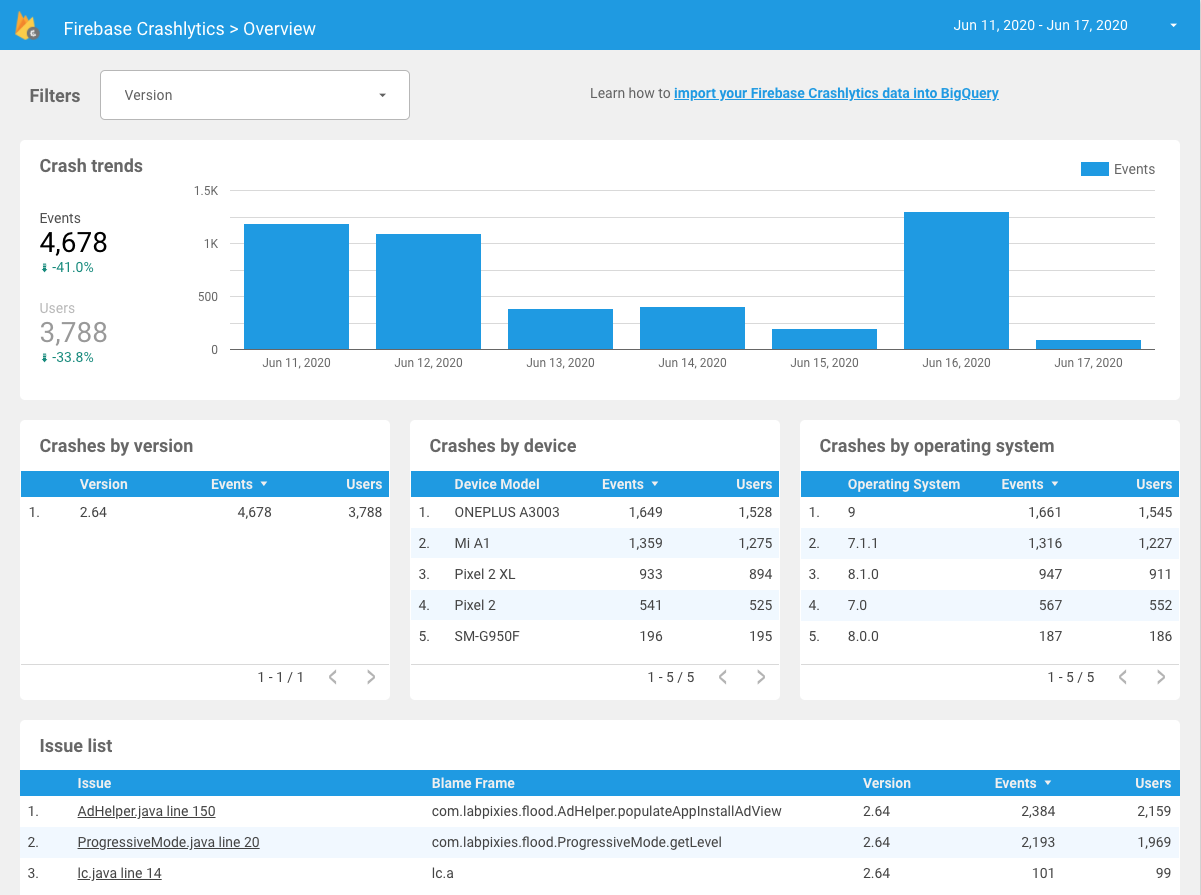
5. Segment crash data with BigQuery and visualize it with Data Studio
Not only can you view your crashes in the Crashlytics dashboard, but you can also export all Crashlytics data to BigQuery. This enables you to filter and segment your user data for further analysis. For example, you can figure out emerging crashes in new code, or see the top Issues for today so you can prioritize and fix them faster.
You can also use our Data Studio template to easily visualize this data with custom dashboards. Data Studio dashboards are easy to collaborate on and share so your team can work more efficiently; even your team members who aren’t comfortable with SQL can easily maneuver BigQuery data sets.
And recently we also launched the ability to export this data in real time, enabling you to power custom workflows and alerts based on real-time data.
Get started
These are just a few examples of the exciting things you can do with Crashlytics to keep your apps stable and your users happy. As always, if you need help getting started please feel free to reach out to us directly through our Community Slack or via Stack Overflow!