
Keeping your app healthy can be a very time consuming process, even if you’re already using Crashlytics. The bigger your app grows, the more difficult it becomes to keep track of all the crashes your users experience, and which part of your ever growing codebase is causing them. By combining Crashlytics with Google Analytics, all of those previous hurdles become much more manageable, with a supplementary SDK that allows you to reproduce issues and keep track of data with much more granularity. Some of these features include a detailed insight into your crash-free user metrics, the ability to use breadcrumbs to track specific events a user went through before a crash occurred, and the ability to link your apps data to BigQuery to easily visualize your apps key metrics.
Crash Free Users
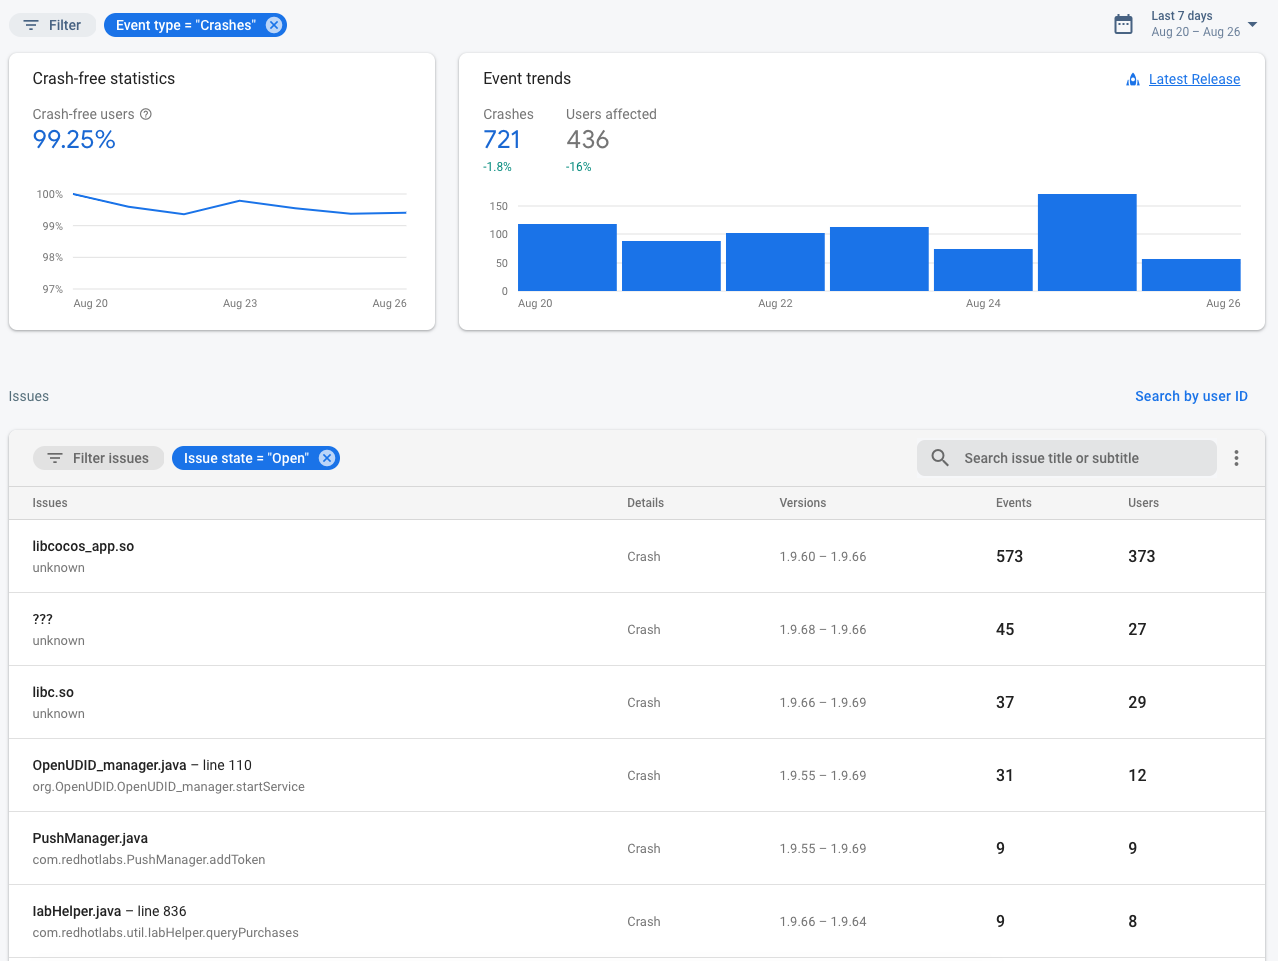
Out of the box, Google Analytics keeps count of the number of sessions, and crashes that occur in your Firebase app. This is done through events that the Google Analytics for Firebase SDK tracks automatically–aptly titled “automatically collected events”. By pulling the “session_start” and “app_exception” events, Google Analytics is able to understand when a user session has started and respectively when a crash has occurred. Having those metrics alongside your Crashlytics data gives you a top level view of crashes in your app, as well as the ability to analyze those individual user sessions that led to a crash. This also provides you a dashboard that allows you to quickly notice a dip or a spike in your Crash Free Users, and to check the crash issues right underneath, to figure out what caused it.
Analytics Breadcrumbs and Custom Events
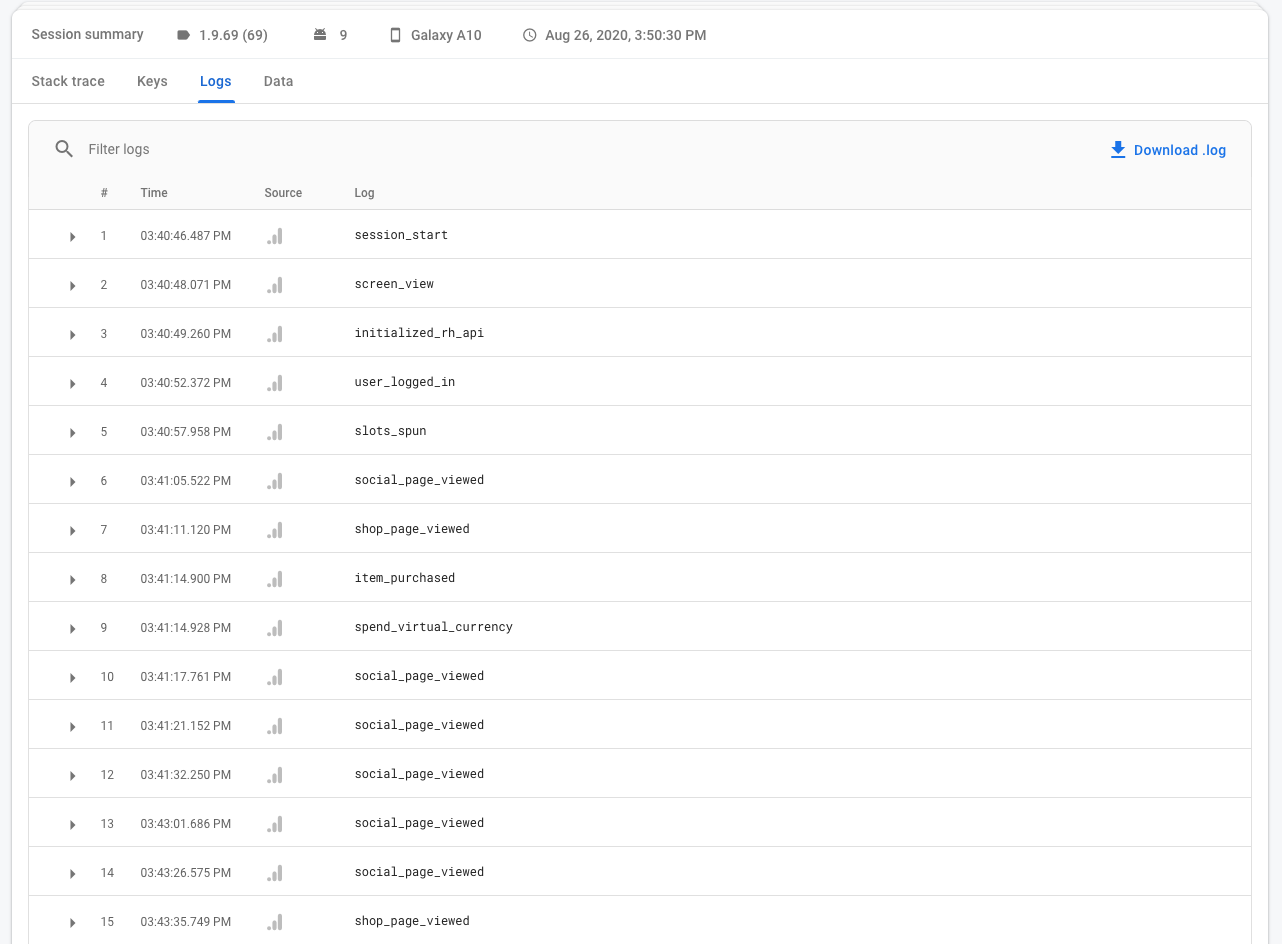
Sometimes, you not only need to know where in your code a crash occurred, but exactly what a user was doing in your app before it crashed. As we mentioned earlier, Google Analytics automatically collects several different events in your app, but you also have the ability to log custom events, and custom event parameters. Crashlytics will then add these custom events to individual crash sessions, allowing you to track user sessions with much more granularity. Using these custom event markers alongside Analytics breadcrumbs, you’ll be able to create a trail leading directly to the users crash.
One example you get out of the box is screen view events. This means if you have both Crashlytics and Analytics, you’ll be able to see exactly what screens your user traveled through before they experienced a crash. You can read more about breadcrumbs and Crashlytics here.
Latest Release
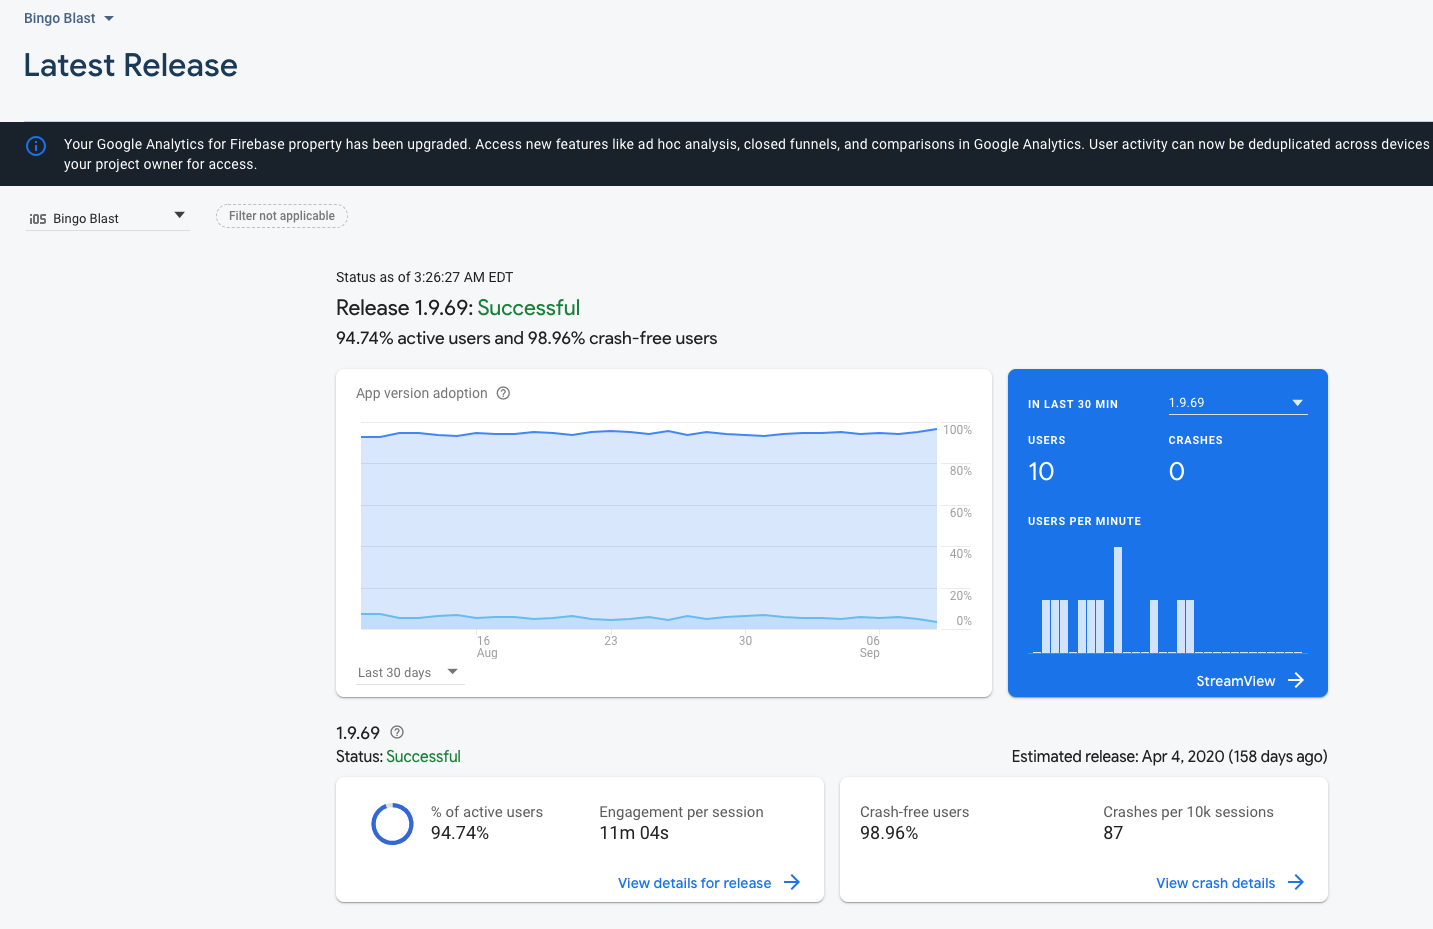
Monitoring the stability of your app within your user base is critical for understanding what your areas of focus need to be. This process has been made much simpler with the Latest Release feature. This display will highlight your data once you have both the Google Analytics SDK and Crashlytics SDK integrated, and you will be able to detect crashes in your app’s most recent version, as well as its most popular versions. This view is extremely useful for identifying a prevalent bug that might appear in your app’s latest version that might not present in other versions. Using this tool will allow you to isolate the issue, and solve it much more quickly.
BigQuery Export
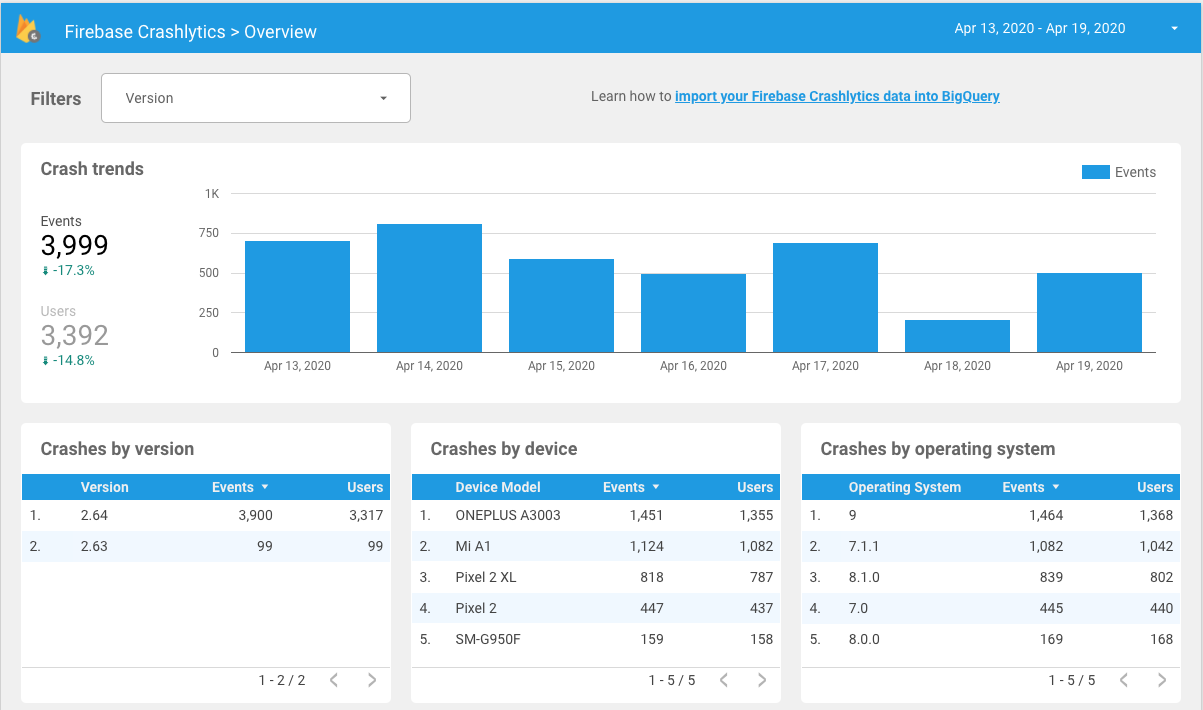
Creating queryable reports on the insights you’ve gathered can be instrumental for your app’s success, among developers and stakeholders alike. Both Crashlytics and Google Analytics offer the ability to export your data into BigQuery and visualize it with Data Studio. You can create complex dashboards that use data from both Analytics and Crashlytics, providing crucial metrics for your business.
By implementing user identifiers or key value pairs into your crash reports, and exporting them alongside your Google Analytics custom events, you can start tying your Crashlytics and Google Analytics data together in order to better understand how stability is affecting your users and your revenue. For example, if you’re a game developer and your users are only getting to the first level of your game before they reach a fatal error, this could be causing a lot of churn. You could figure that out by querying for most pervasive crashes in your app by user ID, and then filtering by your first level custom event.
Picking up on trends such as which crashes are causing your users the most grief in a given week, or figuring out which demographic of users those problematic crashes are affecting, are just a couple of the useful features that exporting your Crashlytic and Google Analytics data to BigQuery will provide you. Here are a handful of useful queries you can try out for yourself!
Conclusion
No party is complete without pizza, and no Firebase Crashlytics integration is complete without Google Analytics. So, whether you’re looking to keep track of your app’s latest version, break down your user data in BigQuery, or just need a robust app development platform, head over to the Firebase console and integrate your app with Crashlytics and Google Analytics!