We made a comic about Crashlytics—the first ever comic created by Firebase! The Great Crash Detective investigates a mystery case of a new crash in her mobile application. Does she solve it, or let her product manager down? Read it to find out!
The Investigation
The inspiration for this comic all started with a customer interview. On the Crashlytics team, we love talking to developers about how they’re using our product. So naturally when a developer reached out to us to find out if there were ways to better understand the events leading up to a crash, we jumped on the task. Crashlytics allows you to add custom logs to your crash data. However, this developer needed help searching through these custom logs to find what events these crashes were occurring within.
The Page Turner
In August of 2018, Crashlytics released the ability to export your data to BigQuery and enhanced it last year by making it possible to export data in realtime. One of the useful things about exporting your crashes to BigQuery is that you can freely investigate the underlying crashes occurring in your app.
We asked the developer who was interested in searching their custom logs if they had considered exporting their data to BigQuery, they explained that they didn’t have bandwidth to learn how to use SQL.

Learning SQL is a continuous process
This was a huge opportunity for us to communicate with customers the alternatives to using SQL (though, we also think exploring your BigQuery data using SQL is pretty great!). For example, Google Data Studio lets you visualize your BigQuery data quickly and easily. You can use our template to customize a report to address your specific needs.
The Mystery Solved
The developer was able to use a Google Data Studio report to visualize their crash reports and analyze their data quickly and easily. They had already followed the steps to enable BigQuery export and the instructions to attach a datasource to our Data Studio Template to create a report, the steps to adding a custom log filter were quick and easy:
First, they navigated to the “Crashes by File” page of the report.

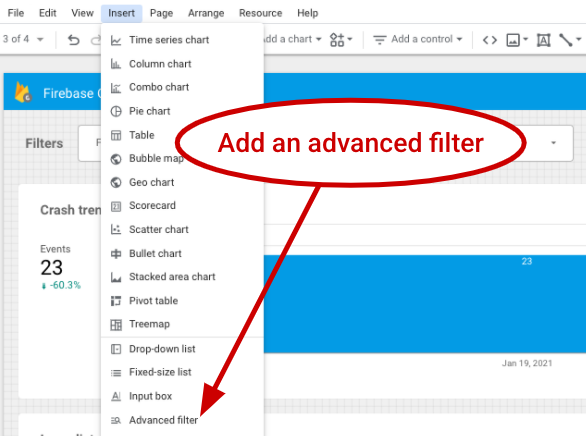
Next, they clicked Insert -> Advanced Filter.

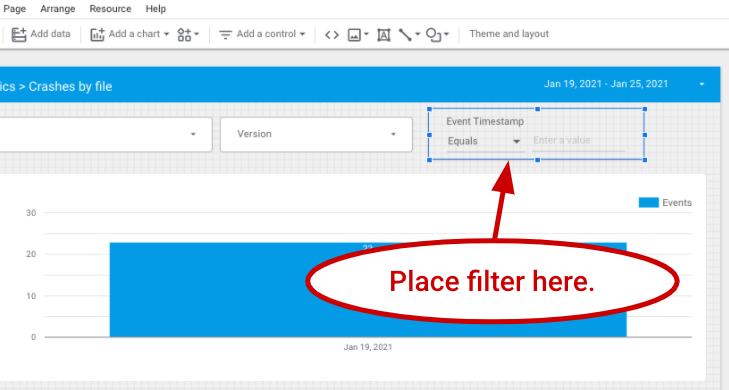
Afterwards, they placed the filter in an empty spot in the report.

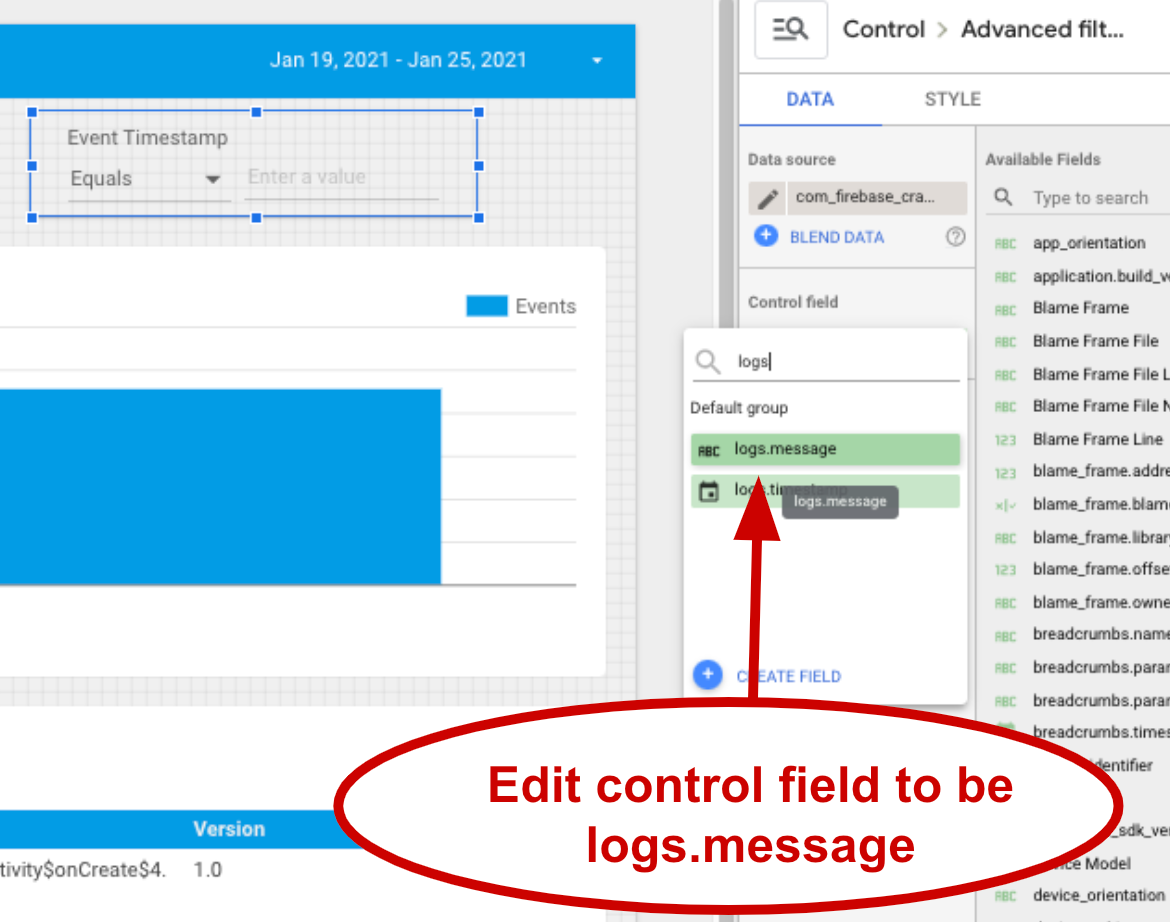
Finally, they edited the control field for this filter. On the data pane (to the right of the report), they changed the control field to logs.message.

That’s all that was needed to search a Crashlytics crash dataset for the occurrence of custom log events (here’s an example template of the above steps). Searching by other fields within Crashlytics crashes, such as analytics breadcrumbs, is as easy as changing the control field for that filter.
Closing the Case
We’d love to hear your feedback. Should we do more Firebase comics? Are you interested in what happens next for the Great Crash Detective? Do you have any feedback about using Crashlytics with BigQuery and Data Studio? Feel free to reach out to us on Twitter or come hang out with us in the Firebase Community Slack channel.

Did we make a comic about Crashlytics, or was it all a dream?
This comic was created by Luke Kruger-Howard, an Ignatz-nominated comic artist, in collaboration with myself and other engineers and product folks from the Crashlytics team.
p.s. Why did the horse’s app crash?
Because the app was unstable.
