
If you’ve ever built an app with Realtime Database you know that it’s fast. When you combine the low-latency websocket connection with the local caching capabilities of the SDK, changes can feel pretty much instantaneous.
But have you ever wondered how fast your database operations are for your users in the real world? As a good app developer you need to collect real-world performance data to make sure that the experience of using your app in the real world matches your expectations! Many people in the tech industry call these field measurements Real User Monitoring (RUM) and they’re considered the gold standard for measuring app performance and user experience. Firebase Performance Monitoring is a free and cross-platform service to help you collect and analyze RUM data for your app or website.
Firebase Performance Monitoring automatically measures common metrics like time to first paint and HTTP request performance. Because Realtime Database uses a long-running WebSocket connection rather than separate HTTP requests we’ll need to use Custom Traces to monitor the performance of our database operations.
Measuring performance
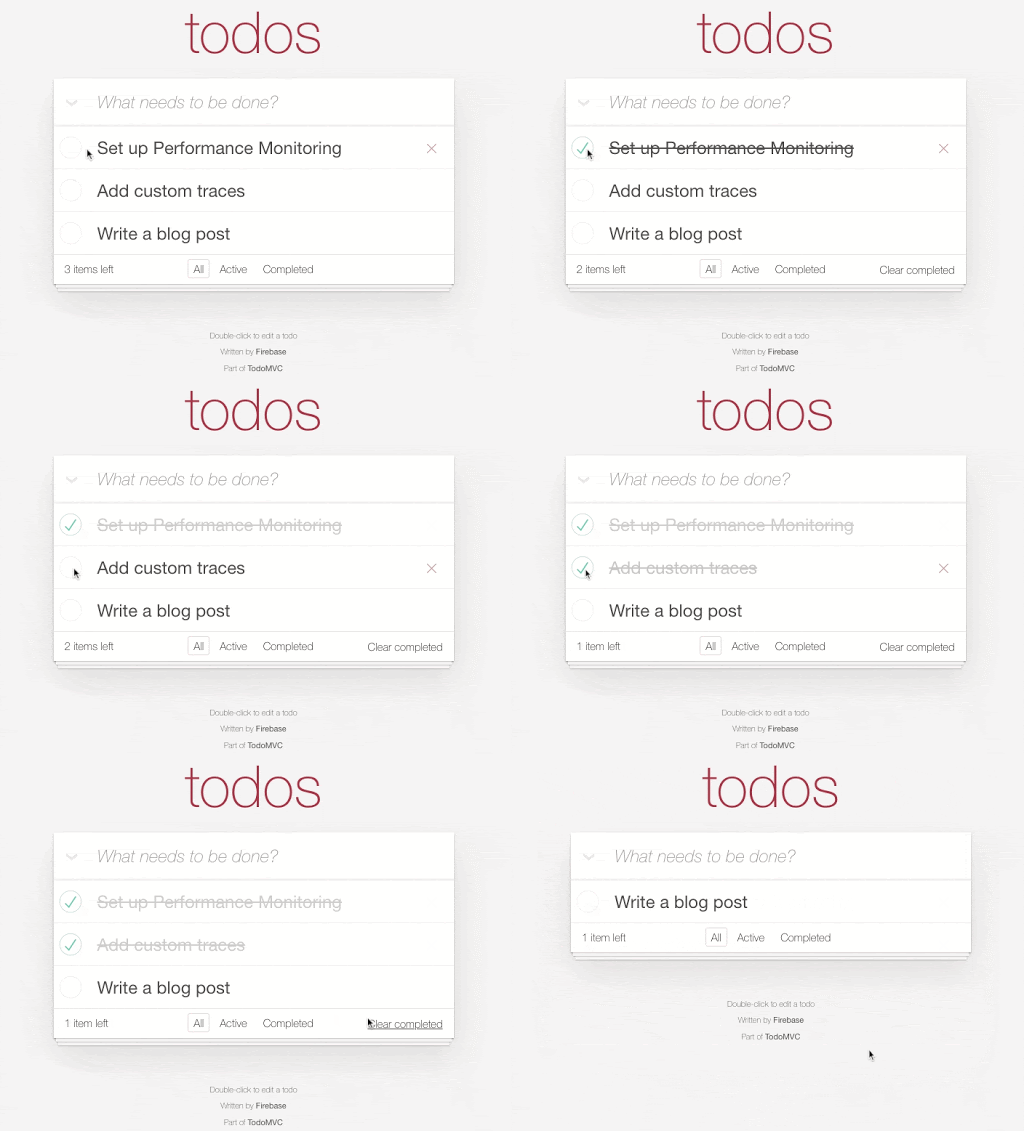
For this post we built a Firebase-powered implementation of the standard TodoMVC app in React using the ReactFire library:
Adding new items
Each time we add, update, or remove an item in our to-do list we’re making a change in Realtime Database directly. For example here’s the code to add a new todo item:
function App() {
  // Get an instance of Firebase Realtime Database using the 'reactfire' library
  const db = useDatabase();

  // Load all the 'todos' from the database
  const todosRef = db.ref("todos");
  const list = useDatabaseList(todosRef);

  // ...

  // Add a new todo to the database
  const handleAddTodo = (text) => {
    todosRef.push({
      text,
      completed: false,
    });
  };

  // ...
}
This operation appears to be instantaneous because the Realtime Database SDK immediately adds the new todo to the local listener while it waits for the backend to acknowledge, or reject, the write. But what if we want to find out how long it actually takes to commit the write on the server?
Tracing server responses
Let’s add some code to measure how long this really takes. We’ll create a new function called tracePromise to help us log a custom trace for any action which returns a Promise and then we’ll add a simple custom trace called add-todo.
function tracePromise(trace, promise) {
  trace.start();
  promise.then(() => trace.stop()).catch(() => trace.stop());
}

function App() {
  // Get and instance of Performance Monitoring using the 'reactfire' library
  const perf = usePerformance();

  // ...

  const handleAddTodo = (text) => {
    const p = todosRef.push({
      text,
      completed: false,
    });

    // Use the 'tracePromise' helper to see how long this takes
    const trace = perf.trace("add-todo");
    tracePromise(trace, p);
  };

  // ...
}
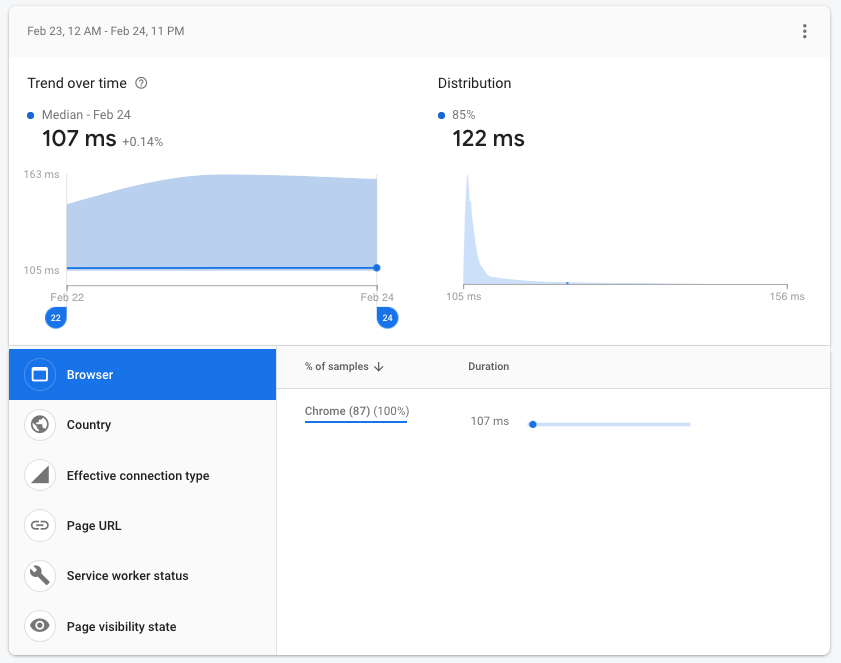
If we deploy this code and head to the Firebase console we can see that the “add-todo” operation takes about 100ms in most cases, with 160ms being the worst case.
Handling latency
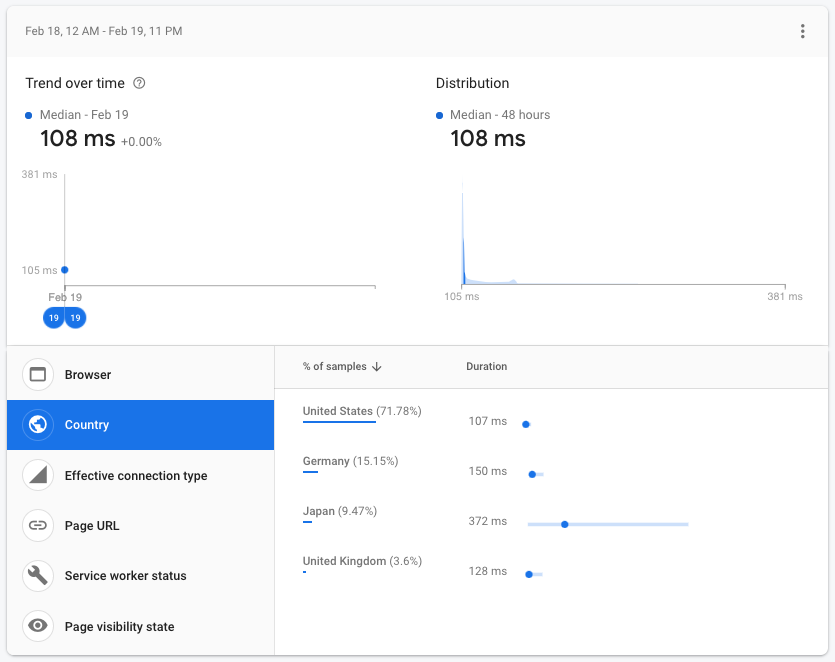
If we break this down by country we can see that the operation is much faster for users in the US than in other countries:
Geography matters
This makes sense! Most Realtime Database instances are located in the United States, which can have an impact on latency for users around the world. Geographic latency increases can depend on physical distances as well as the network topology between two points.
We don’t often think about it when coding but data can only travel at the speed of light! For two points on opposite sides of the earth the speed of light alone adds 66ms of latency, and that’s not including any of the actual network or processing latency along the way. This is why adding RUM to your app is so critical.

New regions for the RTDB
Well, the good news is that Realtime Database is now expanding to more regions around the world, beginning with the launch of our Belgium region in late 2020. A todo list app lends itself really well to sharding because each user’s data is exclusively their own. So let’s add a second Realtime Database instance to our app in the Belgium region, and assign each user to a random database instance to see what effect that has on our latency:
Tracing by location
First we’ll add a custom attribute to our Performance Monitoring traces so that we can filter the data by location later:
function getMyLocationCode() {
  // User's location could be stored in a URL param, cookie, localStorage, etc.
  // ...
}

function tracePromise(trace, promise) {
  // Add a custom attribute to the trace before starting it
  const location = getMyLocationCode();
  trace.putAttribute("location", location);

  trace.start();
  promise.then(() => trace.stop()).catch(() => trace.stop());
}
Now let’s deploy these changes and wait for new user data to come in. After a few days we can see that our experiment worked! First we can see that our distribution now has two obvious peaks:
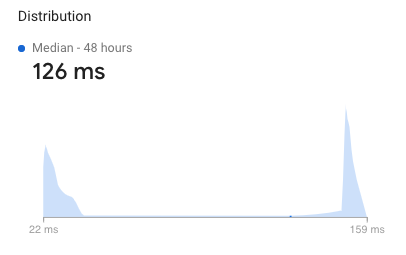
This is what we expected, because we’re now randomly assigning users to one of two database instances. Depending on the one they get, it will either be close to them or far away.
If we look into the data more, we can see that our German users have a really fast connection to the Belgium instance! They’re getting updates in as little as 22ms. That’s a huge improvement over the 150ms+ they were getting when communicating with an instance in the US. While the local caching in the Firebase SDK will make the UI feel snappy either way, this will make a huge difference in the speed of collaborative or multi-device scenarios.

With this RUM data in hand we can be confident that adding a new database region can make our app faster. Next we’ll need to find a way to detect the user location when they sign up and assign each account to the best region for them. For now we’ll leave that as an exercise for the reader!
Get started
If you’re ready to get started measuring performance in your own app, check out these links:
