This is part of a series of articles about app quality. Here is an overview of all the other articles:
- The Firebase guide to building stable, high-performing apps
- Unlocking your app’s best experience with Firebase Performance Monitoring
First impressions matter to app users. Even the most well-designed apps can fall flat if they don’t consistently deliver a crash-free experience.
Picture one of your app users getting ready to unwind after work. They grab a snack, get comfortable on the couch, and open their favorite gaming app … and it crashes. Or perhaps it freezes every time they’re on the brink of reaching the next level. These unstable experiences can frustrate users and may result in them uninstalling or leaving a scathing review on the app store.
In fact, quality issues are the most common reason for early app deletion. One in five users (19%) will uninstall an app due to technical errors or crashes.1
1 in 5 users will uninstall an app due to technical errors or crashes
There are a handful of reasons for app crashes. A user’s device may have low memory or a weak chipset, or it may be running an earlier OS version. Alternatively, the app’s code may be filled with bugs. More importantly, as you add new features and acquire more users on different devices, you’re likely to encounter a wider variety of crashes behind the scenes.
Manually tracking, organizing, and fixing crashes can be a complex and time-consuming challenge. And even if you collect every bit of crash data, it can still be unclear what’s causing your app to crash or which errors are impacting the most users. That’s where having the right crash reporting tools makes all the difference.
Find and fix crashes in real time
Continually improving your app and launching new features is one of the best ways to increase retention and engage new and existing users. However, as your user base grows, splitting your time between releasing new features and monitoring the stability of new releases becomes a bit of a conundrum.
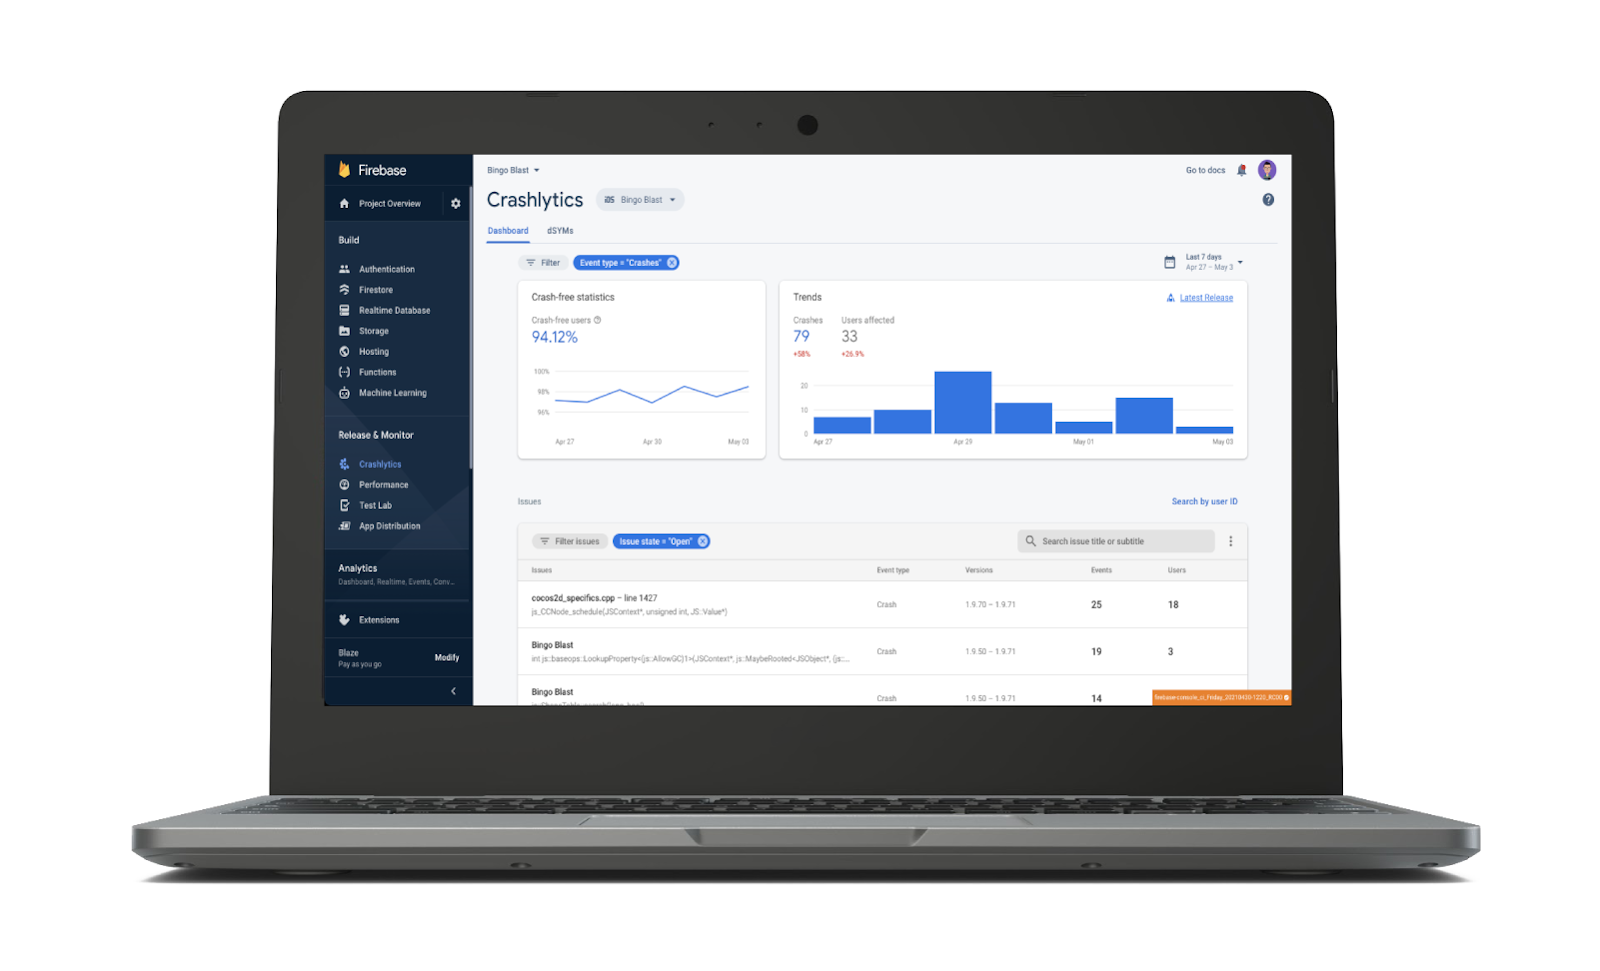
Real-time crash reporting in Firebase Crashlytics allows you to quickly triage and troubleshoot any bugs in your app by gathering and grouping crashes based on where they occurred in your app’s code. Groups of crashes are listed in order of frequency and degree of impact on users, making it easier to identify which issues to tackle and providing you with more time to build features that keep users engaged.

Crash report data displayed in the Firebase Crashlytics dashboard
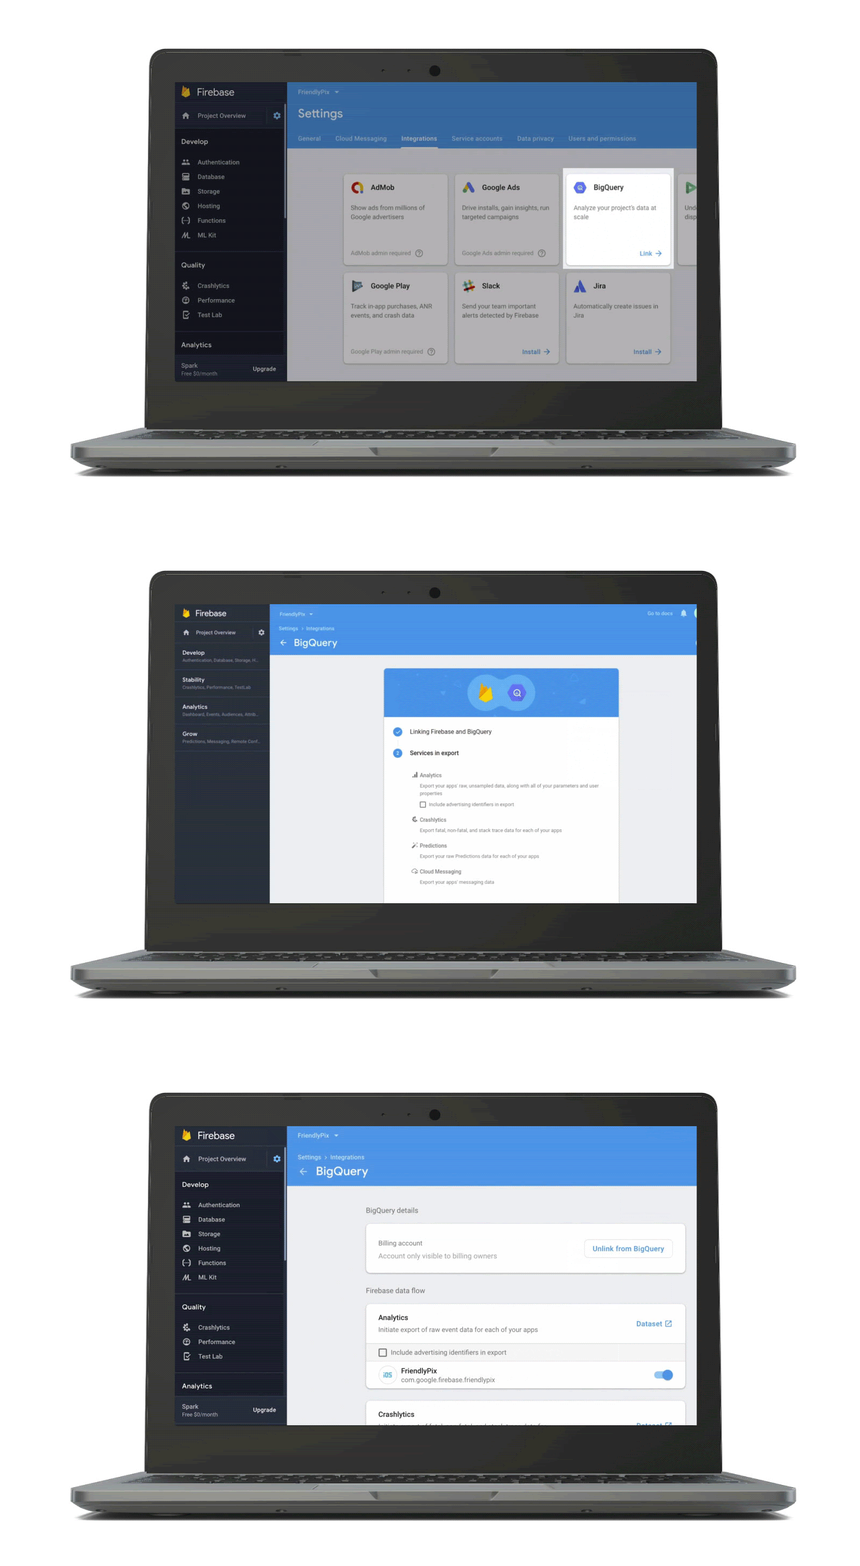
To go even deeper into your crash data, you can enable BigQuery streaming export to identify prevalent issues and understand trends over time — such as which OS versions or specific devices are causing the most crashes. This helps you visualize your crash data and monitor issues that trigger alerts and custom workflows. Enabling BigQuery streaming also gives you the ability to analyze your data with BigQuery SQL, export it to another cloud provider, and use Google Data Studio to create custom dashboards and visualizations of crash trends.

For an app like Spotify — with more than 65 teams maintaining millions of lines of code per platform and launching new updates every week — moving fast and at scale is essential. To reduce stress on its development team before each launch, Spotify switched from manually tracking crashes every day to automating their release process using Crashlytics, primarily with BigQuery. Rather than having the team’s release manager on call to monitor each crash, Spotify now uses Crashlytics to track crashes for alpha and beta builds, set rules for incoming tickets, and assign tickets to the right teams.
Deliveroo, a food delivery company based in the U.K., similarly adopted Crashlytics and BigQuery to get ahead of crashes before they reach a certain threshold while tracking and analyzing performance data of each new release in real time. With the ability to create customized reports and separate errors, the development team drastically cut down on the time spent troubleshooting and reproducing app issues — and crash-free sessions increased from 99.35% to more than 99.7%.
Velocity alerts
Crashes don’t just turn away your existing app users — negative app reviews caused by an unstable session can also impact your ability to acquire new users. That’s why it’s crucial to know when and where crashes are happening.
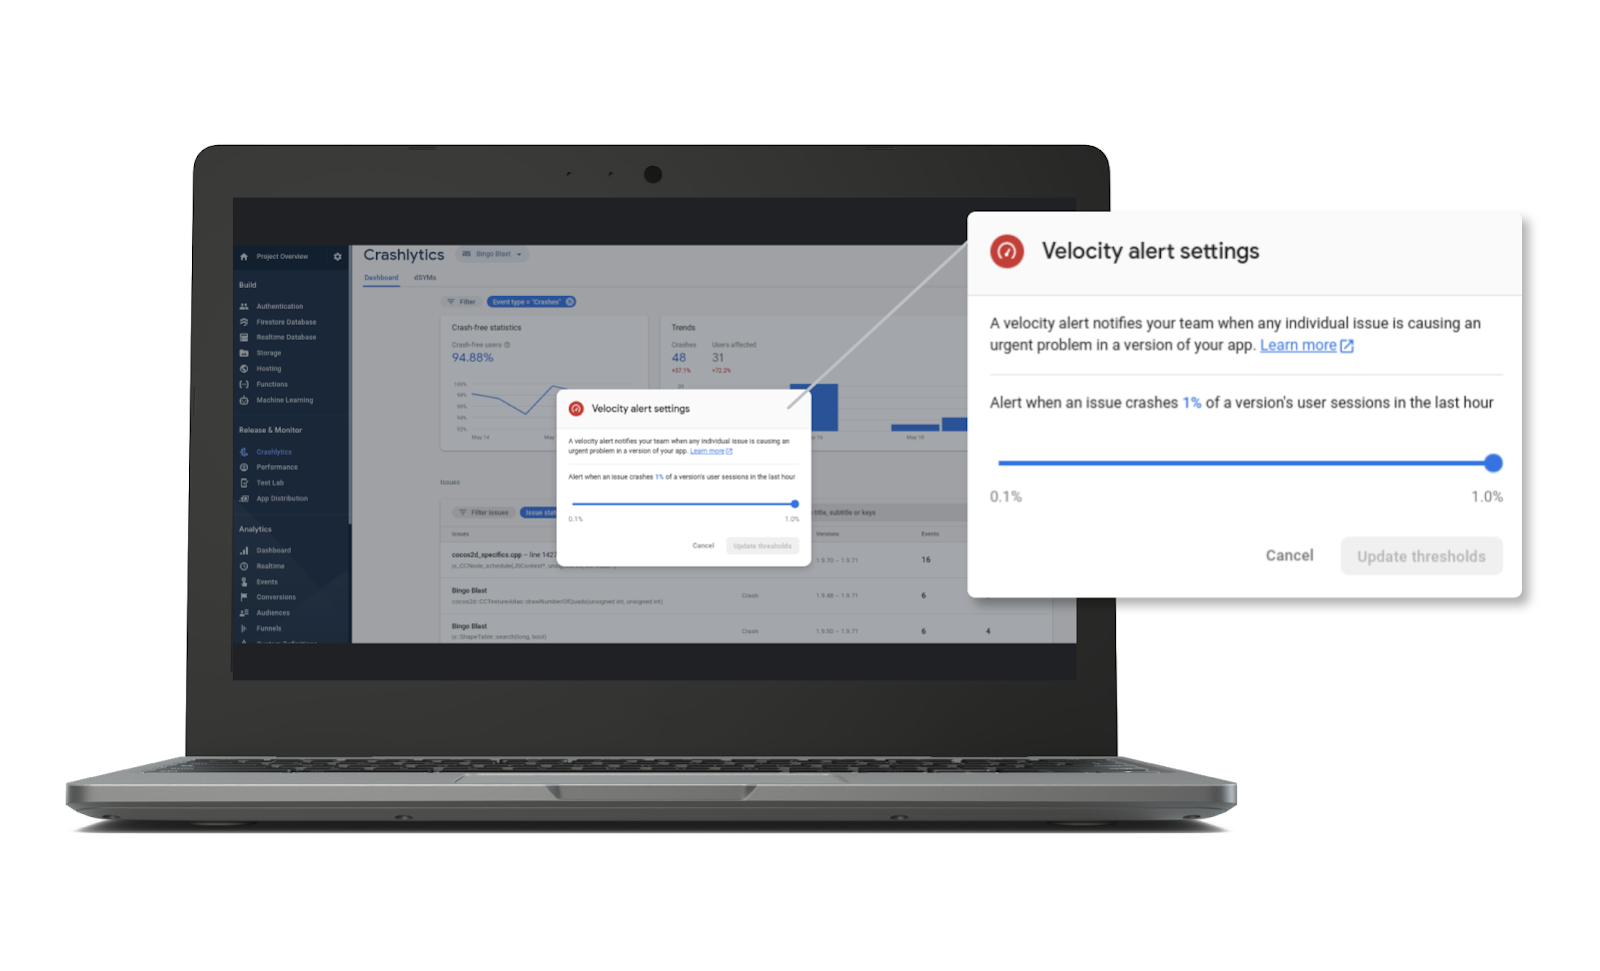
Crashlytics velocity alerts notify you when a particular crash starts spiking so you can respond before the bug impacts more users. Velocity alerts are also configurable, giving you the power to set thresholds that determine when alerts should fire based on the percentage of user sessions being affected.
For instance, velocity alerts can detect major bugs during the rollout of a new release of your app or quickly alert you if there’s an issue impacting a large percentage of users. Velocity alerts will send an email or message on Slack, Jira, or PagerDuty, depending on which third-party integration you have enabled with your project.

That’s exactly how Swiggy — one of India’s largest food delivery services — simultaneously monitors every app issue while focusing on the most significant ones first. Swiggy’s development team connected Crashlytics velocity alerts to PagerDuty and Jira to notify its on-call engineer whenever critical crashes reach a certain threshold. This allowed Swiggy to keep shipping fast with the confidence that they will be notified about high-priority crashes and low-priority crashes in the right manner.
Custom logs and keys
Quickly identifying prevalent crashes is just one piece of the puzzle. By getting to the root cause, you can mitigate risk and avoid frustrating your app users by ensuring those crashes don’t happen again.
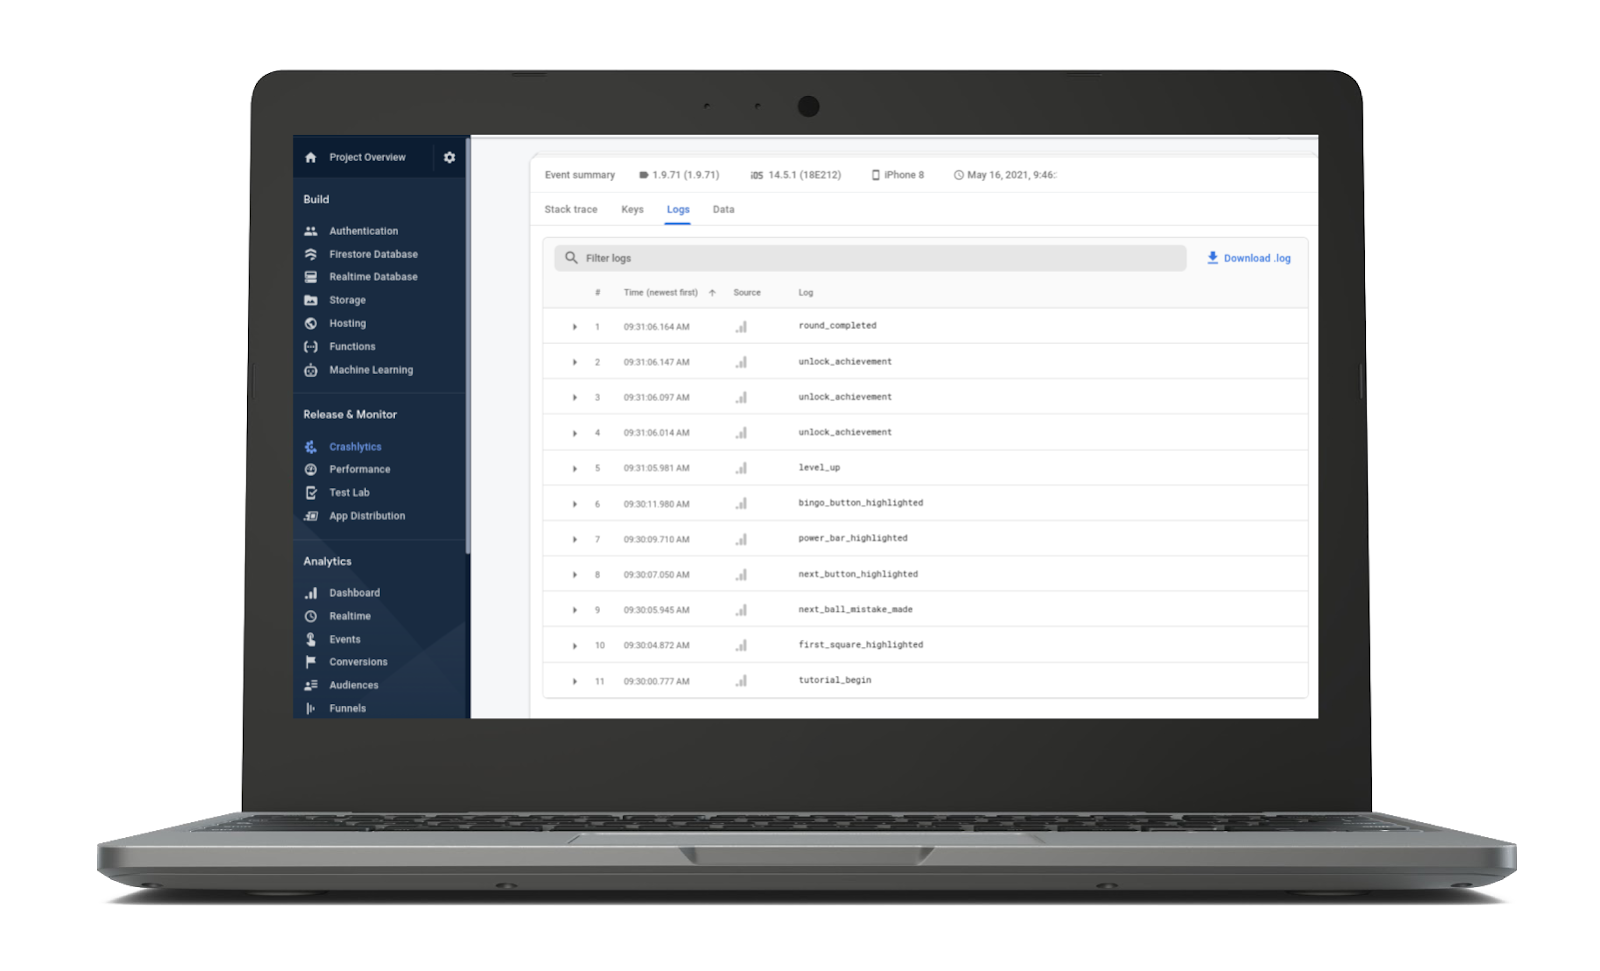
Crashlytics custom logs and keys record the events a user experienced during their session by tracking the state and sequence of their app. This gives you an actionable snapshot of what the user was doing leading up to the moment your app crashed. You can also define custom keys such as “installation_source”, “network,” and “language” to pinpoint exactly what happened before each crash — like whether a user installed your app on the Play Store or if they were connected to Wi-Fi — and reduce the time it takes to reproduce it.
And by using Crashlytics with Google Analytics, you can automatically capture predefined Google Analytics events — known as breadcrumbs — which enhances the data captured with custom logs and provides more detailed information on what caused a crash.

Boosting app ratings by cutting down crashes
For mobile game publishers like Tapps Games, delivering a stable and immersive experience is crucial for keeping gamers engaged. Previously, Tapps would manually search through user reviews for negative feedback and then try to reproduce the crashes that users described. With Crashlytics’ velocity alerts, the team was immediately notified when severe crashes were on the rise. After digging into the data, they realized an update to their Vlogger Go Viral game’s video creation process and a simultaneous community player event was leading to consistent crashes.
Tapps Games’ development team jumped on a fix that helped boost their Google Play store rating from 3.9 to 4.7 and increased their crash-free users from 94.6% to 99.8%.

Give your users the best app experience
To grow your audience, keep users engaged, and spark positive reviews and recommendations, app stability needs to be a key focus area. Installing the Firebase Crashlytics SDK in your app gives you the tools and information you need to stay on top of critical issues.
In the third and final series of our guide, we’ll spotlight a set of tools you can use alongside Firebase Crashlytics to understand how your app is performing from a user’s point of view.

