

This is part of a series of articles about app quality. Here is an overview of all the other articles:
- The Firebase guide to building stable, high-performing apps
- Unlocking the next level of app stability with Firebase Crashlytics
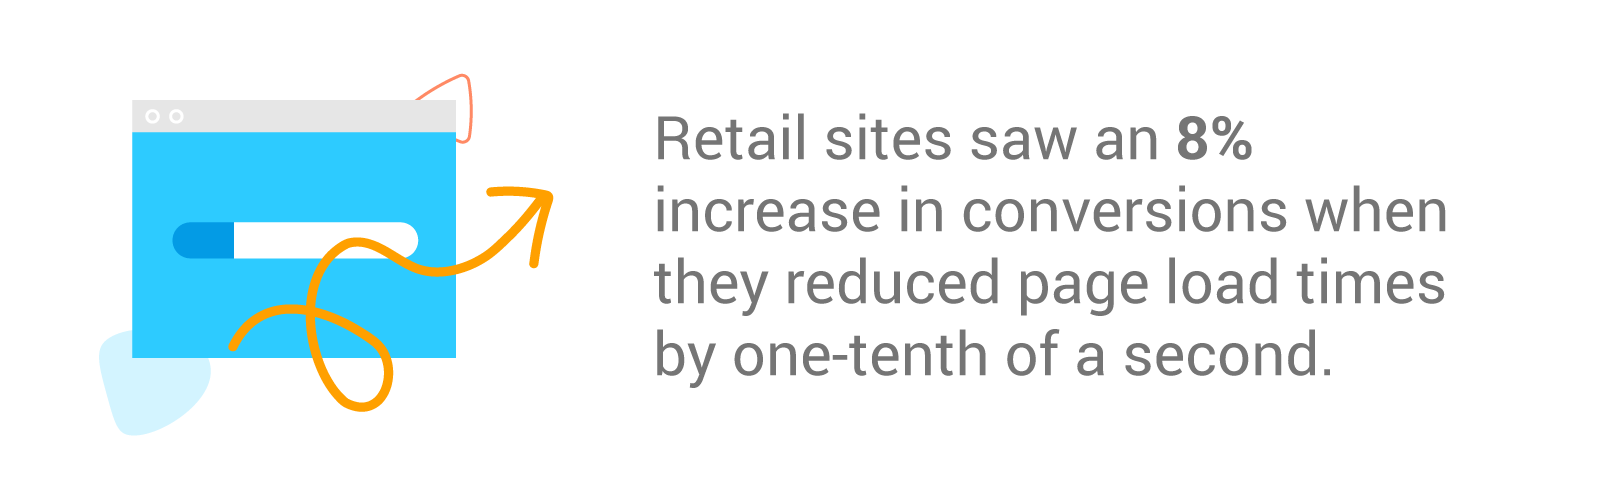
Apps and games have evolved rapidly in recent years, and user expectations for high performance have increased right alongside them. Today’s users don’t just demand speed and performance — they reward it. A 2019 study found that retail sites saw 8% more conversions when they reduced their mobile site load times by one-tenth of a second. And travel sites boosted conversions by just over 10%.
As you reach more users across different devices, locations, OS versions, and networks, optimizing performance becomes even more of a moving target. To understand the unique context behind performance issues, you need actionable insights about your app performance from a user’s perspective. With performance data that allows you to spend less time putting out fires, you can devote more time to creating delightful experiences knowing that no bug or glitch will slip through the cracks.
With performance data that allows you to spend less time putting out fires, you can devote more time to creating delightful experiences knowing that no bug or glitch will slip through the cracks.
In this article, we’ll explore some Firebase Performance Monitoring features that can help you keep an eye on your app’s performance and understand the experience from a user’s point of view.
Real-time app performance metrics
Releasing a new feature that performs well for every user — no matter their location, device, or network speed — can be challenging if you don’t have the timely information you need to gauge performance across a range of variables. When poor performance and low app ratings occur, you need clear insights to deliver an experience worthy of a 5-star review.
Firebase Performance Monitoring processes your app performance data in real time so you can monitor new releases during development and post-launch. For instance, you can gather performance data from Firebase Emulators or virtual devices on Firebase Test Lab to test your app locally before launch. And after launch, you can get insights about metrics related to screen rendering and network requests to learn how your app is performing among different user segments.
By learning how your app responds for different groups of users, you can quickly take action to fix any errors and ensure users won’t delete your app to find one that works better on their device.
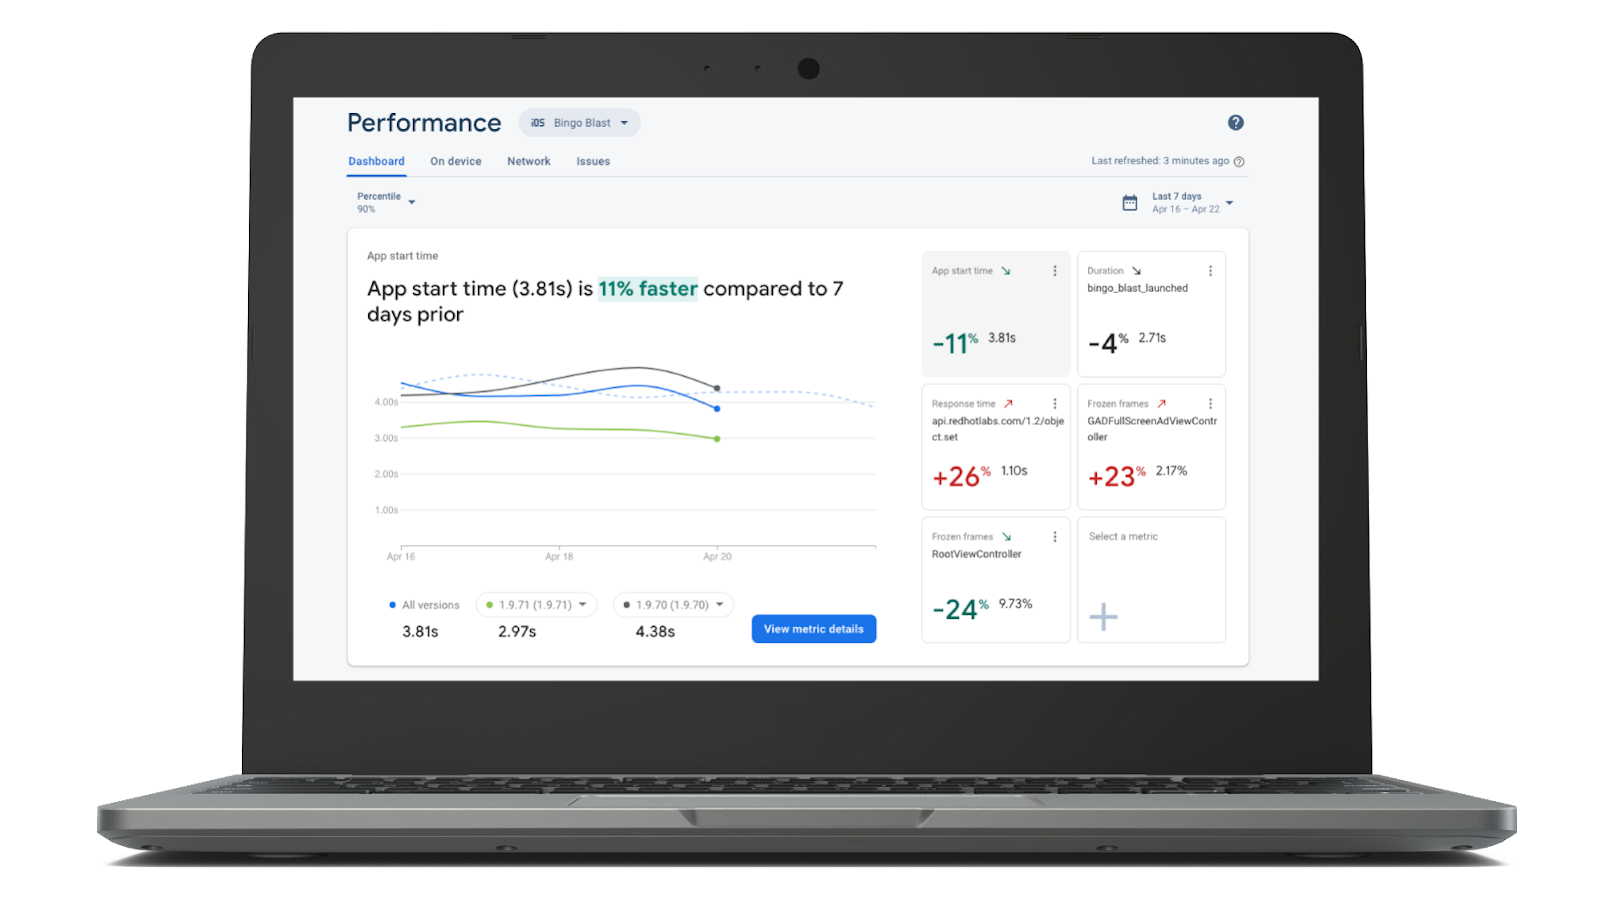
Performance Monitoring dashboard highlighting real-time metrics
Customizable Metrics Board
In the first blog post of this series, we highlighted some standard app performance metrics to keep top-of-mind, such as app start-up time, screen rendering performance, and network performance. However, sometimes the influx of real-time data after a big release can feel overwhelming, and identifying where you should focus and take action can be a daunting task.
With the revamped Performance Monitoring dashboard, you can customize your app performance metrics board to highlight the most important metrics for your app. For example, if you’re releasing updates on a shopping app, you can select and track slow-rendering frames on the checkout screens. This helps ensure your customers are enjoying a seamless experience from start to finish. You can also break down your key metrics by country, device, app versions, and OS level for a deeper dive into your performance data.
By learning how quickly your app responds for different groups of users, you can take action to fix latency issues and ensure users won’t delete your app to find one that works better on their device.
Additionally, Performance Monitoring allows you to implement custom code traces, which help monitor the performance of your app between two points in time. You can also create your own traces to capture performance data associated with specific code in your app. For example, you could use custom code traces to measure how long it takes your app to load a set of images and make sure the graphics aren’t causing too much lag.
Compare performance between app versions
Retaining a diverse user base isn’t easy without understanding how specific user segments are engaging with your app — especially when their experience isn’t up to par. To make sure every new release performs at its best once it reaches a large number of users, you can use the new Performance Monitoring dashboard to identify app performance changes that need immediate attention.
The metrics board enables metric performance tracking across versions. If your latest release calls a new API at start-up, you can track latencies in app start time between the latest version of your app and previous versions. The traces table is especially helpful to understand how your traces are trending across selected time ranges. That means you no longer have to wait for app store reviews or support tickets to know when your app performance is lagging.
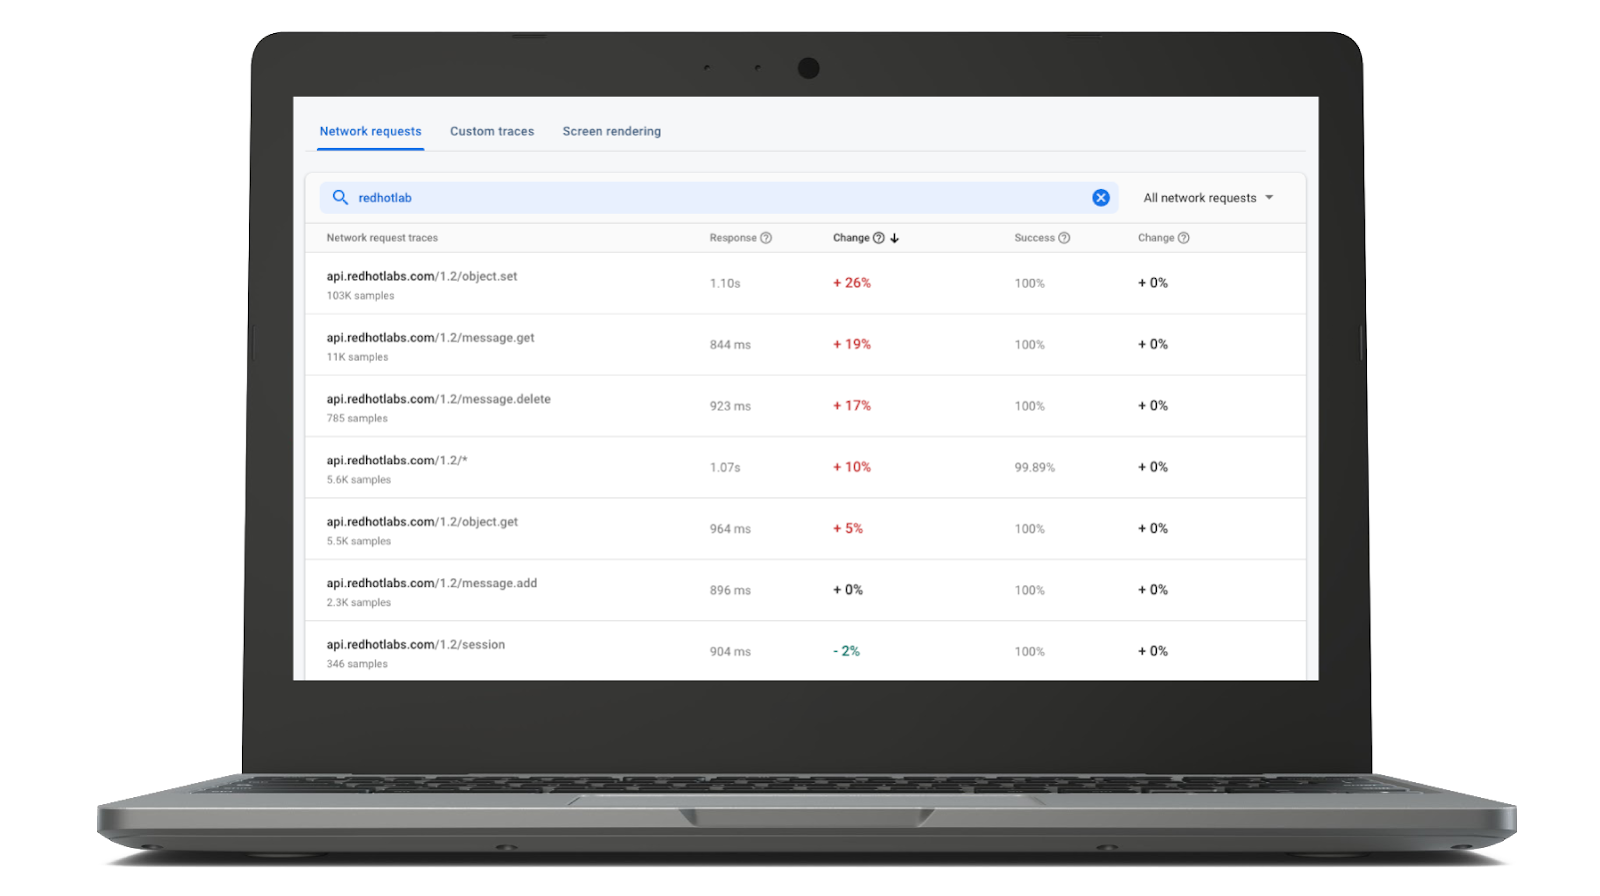
Performance Monitoring traces table
Track trends, regressions, and severe issues
One of the most important ways to grow and engage your audience is by constantly releasing new features and updates to your app. But any code or configuration changes to your app or any of its many dependencies carry a risk of degrading your app’s performance or causing issues with user experience. For example, if your e-commerce app makes dozens of API calls to fetch your catalog and product details, users might experience frustrating lags during their shopping experience.
By tracking trends and regressions with Performance Monitoring, you can quickly act on the most critical issues and get ahead of low ratings on the app store.
Improve user retention with Performance Monitoring
GameNexa Studios, an India-based app developer, seized an opportunity to invest in improving its app quality when their ad sales were disrupted by COVID-19. By combining Firebase Performance Monitoring and Firebase Crashlytics, the team gained actionable insights about its user base and improved their most popular app’s experience across the board. And by reducing the number of performance issues affecting its users, GameNexa ended up boosting both user retention and session duration, and increased in-app purchases by 2.5X.
Stay ahead of app stability and performance issues
To deliver the fast, consistent experience app that users expect, you need a strategy backed by tools that help you act quickly and fix significant issues on the fly. With detailed, actionable data and insights from Firebase, app developers and product managers can make smarter decisions before launch, tackle urgent issues swiftly after releasing an update, and quickly and confidently roll out new features that keep users coming back.
To get started with Firebase Performance Monitoring, integrate the Performance Monitoring SDK into your app and identify the metrics that matter most to your app’s success.