
This article is part of the weekly learning pathways we’re releasing leading up to Firebase Summit. See the full pathway and register for the summit here.
Apps and games have evolved rapidly in recent years, and user expectations for high performing apps have increased right alongside them. Today’s users don’t just demand speed and performance — they reward it. A 2019 study found that retail sites saw 8% more conversions when they reduced their mobile site load times by one-tenth of a second. And travel sites boosted conversions by just over 10%.

Pinpointing an app’s performance issues can be challenging, especially when the culprit is slow network requests from your dependencies or even your own server.
This is where network analysis from Firebase Performance Monitoring can help. Firebase Performance Monitoring helps you understand your app’s performance from the user’s perspective in near real time. You can analyze the performance of each module of your app by monitoring response times, success rates, and payload sizes of your most critical network requests.
Spotting performance pitfalls
Let’s look at how we were able to spot performance pitfalls in BingoBlast - Firebase’s very own demo app.
Automatic aggregation
Out-of-the-box, Firebase Performance Monitoring measures each network request that is sent from your app. To surface the most important trends from the vast number of URLs, Firebase automatically aggregates data for similar network requests to representative URL patterns. Furthermore, this aggregation removes all PII (Personal Identifiable Information) such as home address, username, and password so that developers don’t need to worry about leaking user information.
Firebase displays all URL patterns (including custom URL patterns) and their aggregated data in the Network requests subtab of the traces table, which is the lower half of the Performance dashboard.
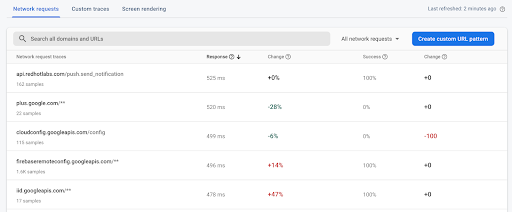
BingoBlast Auto Aggregate Data.
By just integrating Firebase Performance Monitoring into your app, you can quickly see the slowest network requests your app is making and how that performance has changed over time.
For BingoBlast, our traces table shows that some network requests have substantial slowdowns in their response time over the past several days, signaling that there might already be issues needing our attention.
Although Firebase does a great job at automatically generating URL patterns, at times the specific pattern you’re interested in might be hidden under an automated pattern. In those situations, you can create custom URL patterns to monitor specific URL patterns that Firebase isn’t capturing with its derived automatic URL pattern matching.
Custom URL patterns
Custom URL patterns let you specify the patterns that will take precedence over the automatic URL patterns. With custom URL patterns, you can:
- Track a more specific pattern that you’re interested in which might normally be aggregated within a broader pattern.
- Aggregate a group of related URL patterns that might not have been aggregated automatically.
A custom URL pattern consists of the hostname followed by path segments. Subdomains and path segments can be replaced with a * to represent matching with any string.
If a request’s URL matches more than one custom URL pattern, Firebase Performance Monitoring maps the request to the most specific custom URL pattern based on left-to-right specificity. See the documentation for the full details and syntax available.
For example, suppose you configure two custom URL patterns:
example.com/books/*
example.com/*/dog
A request to example.com/books/dog will match against example.com/books/* because book is more specific than *.
Tracking a more specific pattern
To show how custom URL patterns can be helpful, let’s look closer at the data from BingoBlast. Let’s say that we’re worried that an important configuration API request (api.redhotlabs.com/1.2/config.get) might be causing issues in BingoBlast. But, we’re unable to find it in our list of automatic network URL patterns. In this case, Firebase Performance Monitoring has aggregated the configuration API request along with a few other API requests into the api.redhotlabs.com/1.2/* URL pattern.
To get better insight into any performance issues this API call might be causing, let’s use a custom URL pattern for this specific request.
To do this, we just click the Create custom URL pattern button in the traces table, then enter api.redhotlabs.com/1.2/config.get into the dialog. After the new pattern is created, the traces table will start displaying the new custom URL pattern based on new data.

Creating a new custom URL pattern.
Since this is an important API request and we want to track our improvements to it over time, we can add metrics (like response time) for this new custom URL pattern to our metrics board at the top of the Performance dashboard page. These metrics cards are a great way to provide a quick overview of your most important metrics.

Pin your most important metrics to the top of your dashboard.
With api.redhotlabs.com/1.2/config.get extracted as its own URL pattern, it’s easier to monitor for any unwanted changes in the performance of these requests. We can then take action, like removing the request from the app’s critical path or recommending improvements for the backend implementation.

Grouping related URL patterns
On the other hand, we sometimes want to group related URLs into a single URL pattern. In BingoBlast, we have included a library that plays a short video. However, we noticed that our traces table is showing many separate URL patterns to different googlevideo.com subdomains.
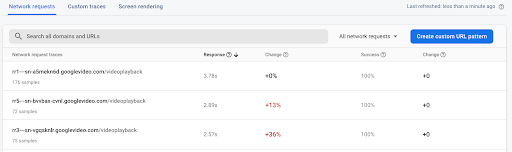
Since we’re more concerned about the overall performance of the video requests, as opposed to which specific subdomain they’re from, we can create a custom URL pattern *.googlevideo.com/** to aggregate all these URLs into one pattern. This makes it easy to understand the performance for the video and, as a bonus, makes our traces table more tidy!

Firebase Performance Monitoring provides a wealth of data on how your users experience your app. By leveraging Firebase’s out-of-the-box automatic URL patterns and tailoring your dashboard with custom URL patterns you’re most interested in, you can easily pinpoint slow performance areas in your apps and quickly boost your app’s responsiveness.
View the full learning pathway
Make the most of Firebase and view the full learning pathway for additional codelabs, videos and articles on creating fast and stable apps. And don’t forget to register for Firebase Summit, happening November 10th to learn how Firebase can help you accelerate your app development, release with confidence, and scale with ease!