
Mobile users expect their apps to be fast and responsive, and apps with a slow startup time, especially during coldstart, can leave them feeling frustrated. Firebase Performance Monitoring is a tool that helps you gain insight about various app quality signals, including startup time of your application. This article gives a deep dive into the Firebase Performance Monitoring tool and its impact during an Android application’s cold start.
Library impact at startup
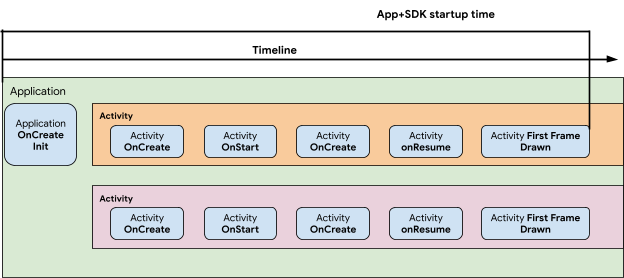
Modern Android applications perform multiple operations until the application becomes responsive to the user. “Startup time” of an application measures the time between when an application icon is tapped on the device screen, to when the application is responsive. Code executing during startup time includes the application’s code, along with code from dependencies that are involved in app startup. Any code that executes until the first frame is drawn is reflected in the time to initial display metric.
Many libraries do not need to get initialized during the application startup phase. Some libraries, like Firebase Performance Monitoring, provide value by initializing during the startup phase. It is this early initialization that enables measurement of app start, CPU/Memory impact during early phases of startup, and performance of network requests during application startup. But, this could lead to an increase in the startup time of the application.
You can measure the impact of a library during your app’s startup by creating 2 versions of your app (with and without the library) and measuring the “time between Application launch to Activity firstFrameDrawn” in both to compare.
Firebase Performance Monitoring at startup
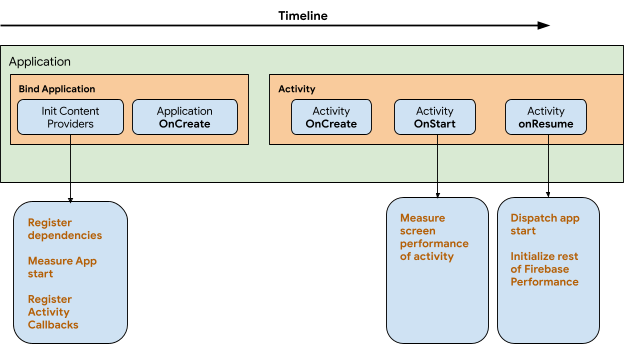
Firebase Performance Monitoring performs the following tasks during an application cold start:
- Registers dependencies
- Configuration management: Controls measuring performance metrics on a percentage of devices by looking at locally cached configurations
- Firebase Installations: Installation service for each Firebase installed device
- Initializes the performance library
- Tracks the startup time of the application
- Measures detailed system metrics (CPU/Memory) for a fraction of the cold starts (See sessions).
Firebase Performance Monitoring does all these without developers needing to add any lines of code to their application.
Performance Monitoring app startup time optimization
There are many tools available to profile the performance of an application. We used the following tools for measuring the startup time and analyzing the impact of every single method in our library during application cold start.
Macrobenchmark is a recent tool launched at Google I/O ‘21 to measure the startup and runtime performance of your application on physical devices. We used this tool to measure the overall time taken by an application during a cold start.
Method tracing enables understanding all the classes/methods that were involved in the runtime of an application. This lists down the different methods that get executed at runtime and the duration each method takes for execution. Due to the overhead of method tracing, the duration of methods as specified in the trace file is bloated. Nonetheless, this duration can be used as a guiding metric to understand the impact of a method.
Using the method tracing APIs, we identified multiple opportunities within the application’s lifecycle events to reduce the impact of the library during application startup, including:
- Content Provider
- Activity Create
- Activity onResume
We optimized the library in all these phases. Some key optimizations include:
- In the content provider phase, we moved away from eager initialization to lazy initialization creating components when needed. Eg: dependency initialization.
- In the phases of activity onCreate() and onResume(), we moved many of the non-essential operations from main thread to run on background thread allowing the main thread to focus on the applications’ needs (#1, #2)
- Delayed initialization of certain non-urgent firebase performance components to a later time after the application has performed its startup operations. Eg: Event dispatch service
- Delayed fetching of remote configurations Eg. Firebase Remote Configuration
Impact of Firebase Performance Monitoring
To benchmark the impact of Firebase Performance Monitoring, we built a simple Android application. Benchmarking performance depends on various factors. To make this measurement close to user needs, we measured the startup time with the following factors.
- Simple empty android application
- Samsung 2019 model device
- Android API Level of the device - API level 29
- Macrobenchmark version: 1.1.0-alpha09 (Compilation mode: Full)
- Firebase performance library version - 20.0.4
- We ran the application with and without Firebase performance library to understand the startup time impact caused by the library. We used macrobenchmark to measure the duration of the startup time.
For an empty application with the above ground conditions, the table below captures the impact of the application startup before and after the optimizations.
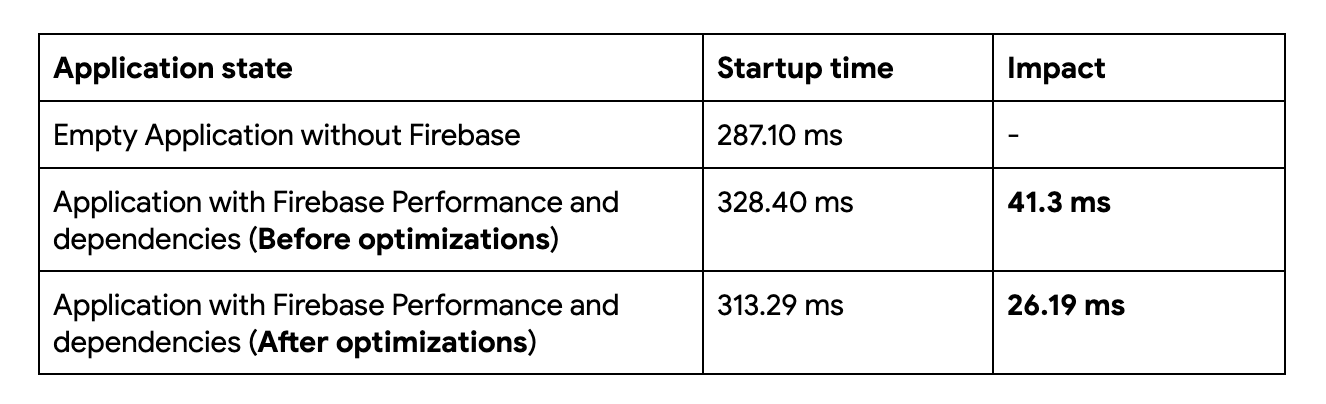
With all the above changes, we have been able to reduce the impact of the library during startup time by more than 35%.
What’s next?
Application startup time improvement is a moving target for all developers. Though device hardware has been dramatically improving in recent years, the challenge of improved startup time performance continues to push barriers. We are continuously investing in reducing the startup time impact.
Update your Firebase Performance Monitoring SDK to the recent version to get these recent improvements on startup time, realtime metrics and alerts.