
Firebase provides a wide range of serverless products and services. While these are great to use and build your app in no time, monitoring these serverless products and drilling down into any issues can be a bit tricky. When faced with an issue, it’s important to know all the monitoring tools that you could leverage. Many Firebase products make use of Cloud Monitoring to provide dashboards and alerting. Let’s take a look at how to monitor Firebase Security Rules and App Check using Cloud monitoring.
Monitoring Security Rules
Firebase Security Rules provide an authorization layer for all the Firebase database products. If you are seeing a high amount of access denials by your Security Rules, this could indicate that someone is trying to gain wrongful access to your users’ data. Or if you just deployed a new version of Security Rules, this could indicate a bug in your Rules, which is breaking legitimate user accesses. In either case, you would want to know as quickly as possible, so you can modify your Rules or stop the malicious users by enforcing App Check.
Finding error metrics
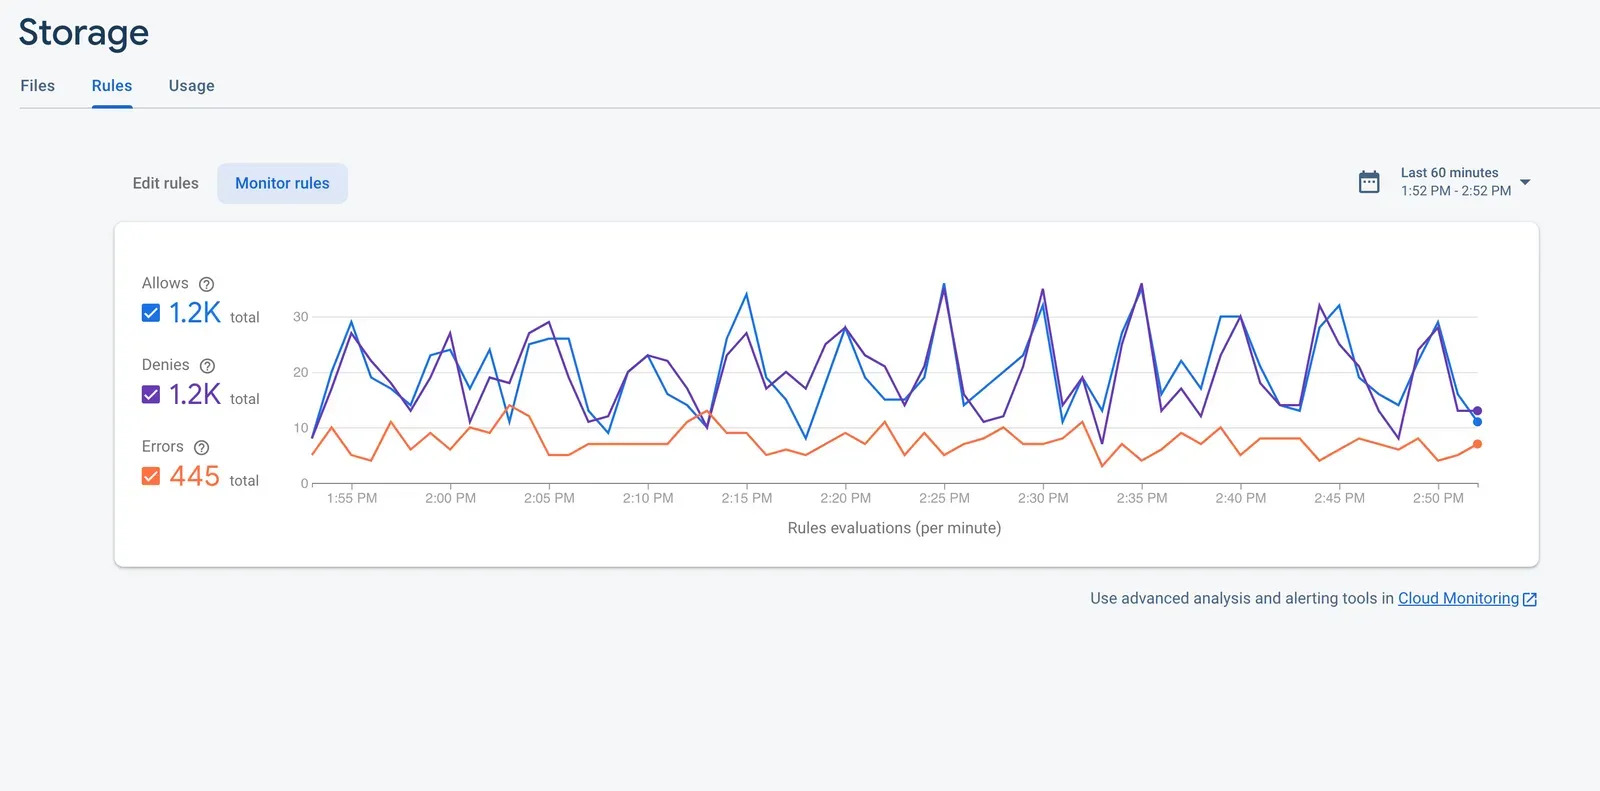
First, where can we see these metrics? Firebase Console displays the metrics on the “Rules > Monitor Rules” tab for each of the products that use Security Rules. For example, you can see the metrics for Firebase Storage Rules below:
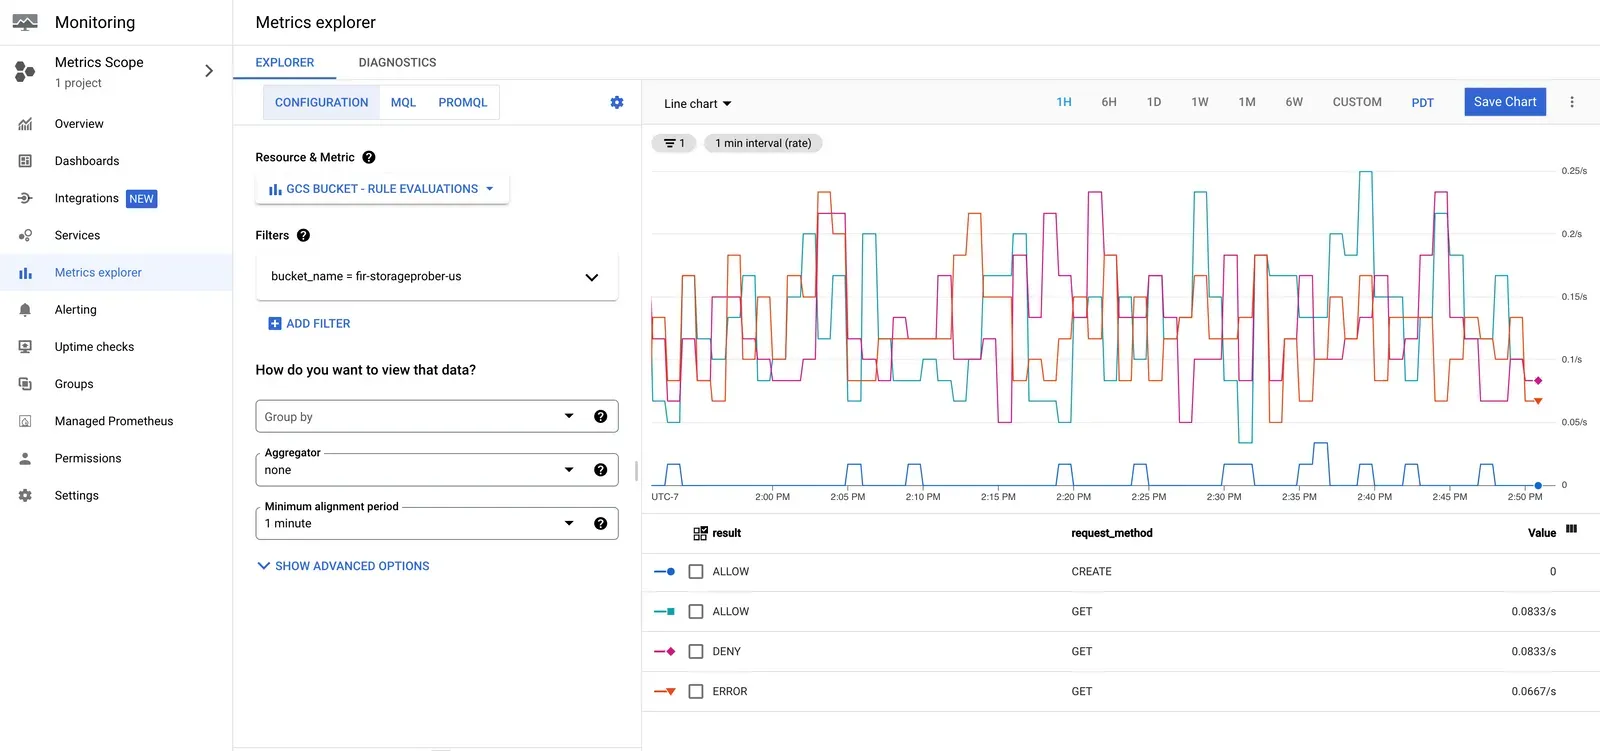
These metrics are sourced from Cloud Monitoring, so you can also see these metrics on your Google Cloud Console, on the “Monitoring > Metrics Explorer” tab, by looking at the “GCS BUCKET - RULES EVALUATIONS” metric. Here, you can also apply Filters and Aggregators on the data for performing advanced analysis.
Alerting
Now in case there is a spike in your Rules DENYs, how do we detect it immediately, so we can restore access to legitimate users? Cloud Monitoring provides Alerts that can notify you of any problems in your application so you can resolve them quickly.
To detect the spike in Rules DENYs, you can create a metrics-based alerting policy like the following:
If the QPS of Rules evaluations with result = DENY is higher than 20 QPS for at least five minutes, then open an incident and send an email to your support team.
This policy means that if the Rules evaluations result in more than 20 QPS DENYs continuously for five minutes, then the condition is met and an incident report will be created. A transient spike in DENYs doesn’t cause an incident report to be created.
In the alerting policy settings, you can specify your preferred Notification channels, instructions for your support team on how to handle the incidents, labels for indicating severity, etc. More detailed information on creating an alerting policy using the Cloud Console can be found here. You can also use Cloud Monitoring API or the Google Cloud CLI to create the policies.
Setting up alert policies
For setting up the current alert policy, you can do the following steps:
1. Head to the Cloud Console.
In the Google Cloud console, go to Monitoring > Alerting and then click Create Policy.
2. Set up rules evaluations.
Click Select a Metric and enter Rules evaluations.
3. Pick the resource bucket
Select the resource for which you want to set up the alert under the Active Resources, for example, GCS Bucket and then select the Metrics category as Rules and the Rules evaluations metric and click Apply.
4. Setting up Rules evaluations
To choose the Rules evaluations with a DENY result, click Add Filter. Set the Filter to result, Comparator to = and Value to DENY.
5. Optional: Transform data
To change how the points in a time series are aligned, set the Rolling window and the Rolling window function in the Transform data section. Storage Rules evaluations metric is sampled every 60 seconds. The defaults values of Rolling window = 5 min, Rolling window function = mean, indicate that Monitoring will take the mean value of the Rules DENY QPS across 5 samples collected in the last 5 mins to get the value used to evaluate the alert condition.
6. Condition trigger
Click Next and configure the condition trigger. Here, you can leave the Condition Type as Threshold. Choose Alert trigger as Any time series violates. Leave the Threshold position as Above threshold and set the Threshold value to 20, which is the QPS you want.
7. Set the duration window
To set the duration window for which the alert condition needs to be met, expand the Advanced Options section and set the Retest window to 5 min. When there are no Rules evaluations with DENY result, the data should be considered not violating. So set the Evaluation of missing data to Missing data points treated as values that do not violate the policy condition.
8. Finalize the alert
Click Next to configure the notifications and finalize the alert. It is recommended to configure multiple notification channels for redundancy.
9. Notification Channels
Choose your preferred Notification Channels, under Policy user labels you can add a severity label, for example, Key = “severity” and Value = “critical”. In the Documentation section, you can add any incident response documentation, to help the support team with triaging and resolving the incident. Finally, under Name the alert policy, add a name, say Firebase Storage Rules DENY Alert.
10. Verify and create
Click Next. Verify that all the settings look correct. Also verify that the threshold values shown in the graph would not trigger alerts too frequently. Click Create Policy to finish setting up the alert.
Now say your app gets super popular and someone tries to attack your app and get access to your users’ data. When Monitoring sees that the Rules evaluations are failing for more than 20 QPS of the requests, it checks for continuous failures for the next 5 minutes and when the condition is met, it opens an incident, and it sends a notification to your support team.
Following the documentation in the notification, your support team can verify whether there was a new Rules release that triggered the incident or if the traffic includes bad requests and has spiked the invalid requests in App Check too. They can then mitigate the issue by either enforcing App Check if possible or blocking certain users sending the bad traffic. When the Rules DENY rate drops to less than 20 QPS, Monitoring will automatically close the incident.
Setting up such alerts also helps with safer rollouts as you can be much more confident that any issue with a new release rollout will be caught and notified.
Monitoring App Check metrics
App Check also integrates with Cloud Monitoring, and taking the time to set up some dashboards and alerts there can be helpful.
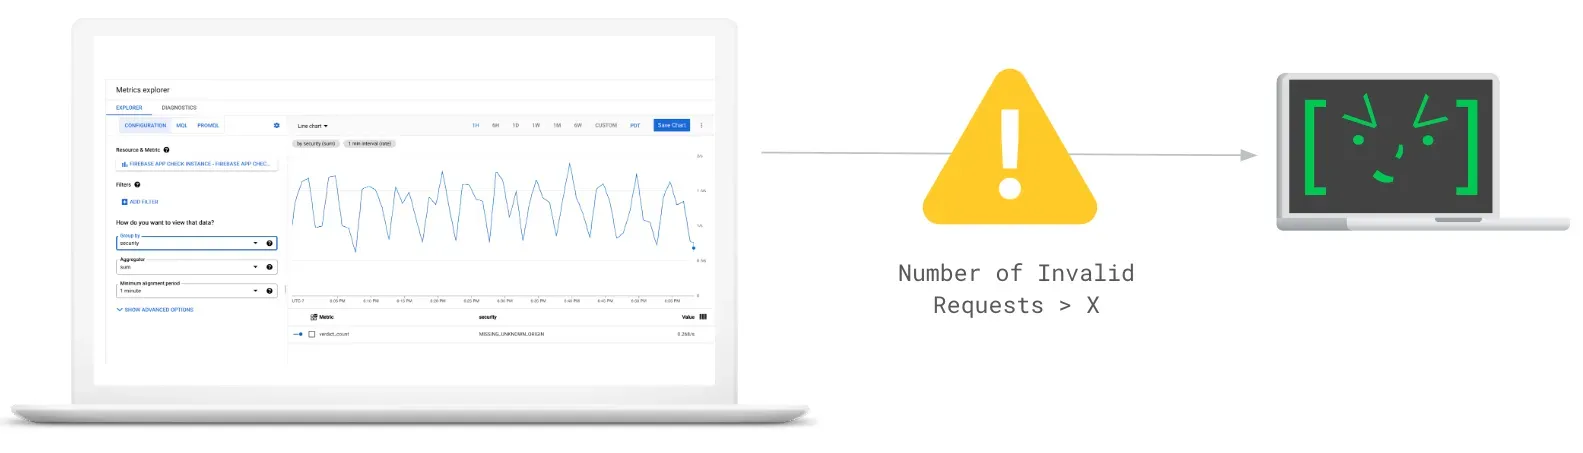
Invalid requests
For example, you could set up an alert for a spike in invalid requests for Firestore. This would let you know that someone may be trying to probe or attack your app.
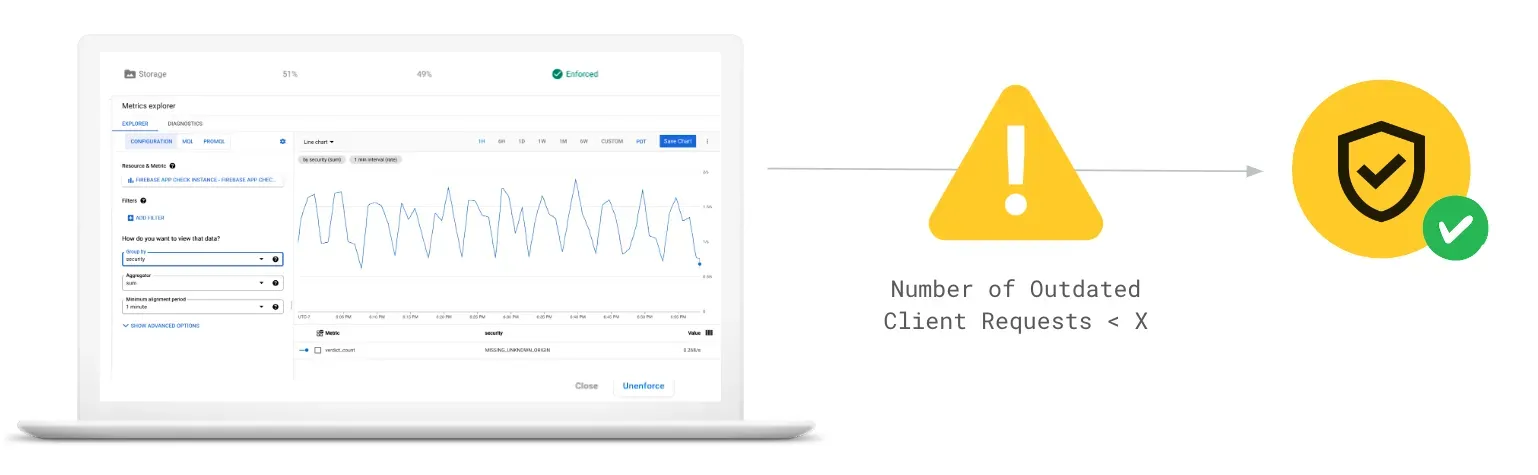
Outdated clients
Another example is to set up an alert when the number of Outdated Clients for Firestore becomes less than, say, 5 per second, or some threshold that makes sense for your app. You could use this if you’ve enabled App Check, but want to know when the number of users on old versions has dropped low enough that you’re ready to enforce App Check.
Note that App Check metrics can also be found on the “Build > App Check” tab on the Firebase console, when you click on any of the products listed that have enabled App Check. These are the same metrics that you see in Cloud monitoring.
Takeaways
If you have a Firebase app in production we strongly recommend setting up Cloud Monitoring integrations for App Check and Security Rules as a baseline level of observability. It gives you insight into how your system is being used or abused, as well as how it’s performing under that use.
And hopefully this is just the start of instrumenting your Firebase apps for security observability. If you’re performing any sensitive actions in Cloud Functions for Firebase, you’ll also want to set up monitoring to debug any performance or usage problems. And Firebase Authentication has Cloud Monitoring integrations to help you debug problems if you see, for example, a spike in failed login attempts. So get started with Firebase security observability today!