


From summarizing text and generating images, to translation and helpful agents, generative AI is becoming commonplace in app development. With the launch of Firebase Genkit Node.js 1.0, we’re making it easier than ever to build generative AI features into your applications.
Building with LLMs requires skilled prompt engineering and configuration to ensure consistent and expected results. While Genkit’s local development tools are invaluable for building and refining production-ready features, unexpected issues can (and will!) pop up in real-world production scenarios. Issues like unexpected or delayed generations can negatively impact your end user’s overall experience. Production monitoring and observability is crucial to detect issues promptly and allow you to swiftly take action.
Luckily, Genkit is automatically instrumented to collect telemetry data and offers Firebase Genkit Monitoring - production grade tooling to let you monitor and observe your Genkit features in the Firebase console, to know that it’s working and delivering the expected experience for your end users. In this blog post, we’ll give a quick overview of the main features of Genkit Monitoring and how to get started.
Getting started with Genkit Monitoring
If you are new to Genkit, check out the Getting Started Guide for step-by-step instructions on building your first AI feature. Once your feature is built and ready for production, turning on telemetry export is a matter of installing the @genkit-ai/firebase plugin in your project:
npm i -save @genkit-ai/firebaseImporting enableFirebaseTelemetry into your Genkit configuration file (the file where genkit(...) is initialized), and calling it:
import {enableFirebaseTelemetry} from '@genkit-ai/firebase';

enableFirebaseTelemetry();
And redeploying your feature to production.
High-level overview of each Genkit-powered feature
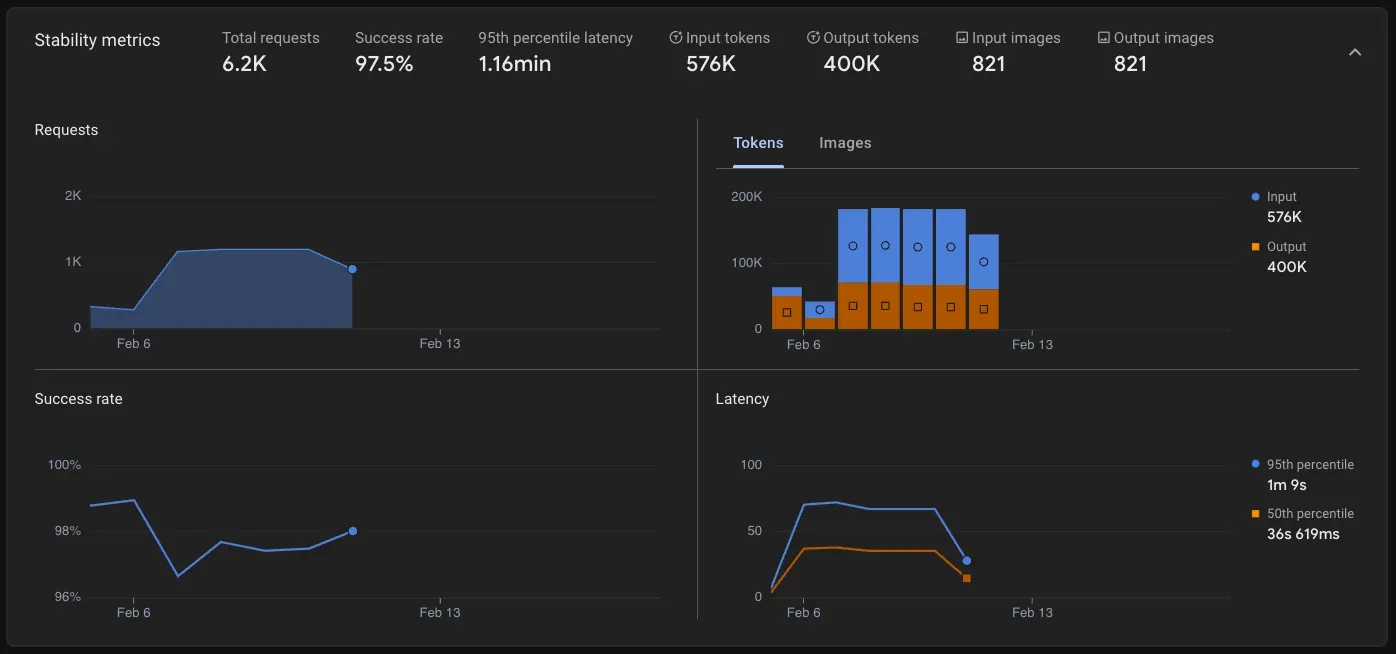
After adding the Firebase telemetry plugin and deploying your Genkit feature, data is automatically written to GCP Logging, Trace, and Monitoring, and viewable in the Genkit Monitoring dashboard in the Firebase console. The landing page gives you a high level overview of the health of each of your Genkit features - showing metrics around usage, success rates, and p95 latency. This serves as the starting point to identify any issues that need additional investigation.

The metrics are also broken down by each of your Genkit features, including the input and output token count. In many cases, the token count is a good proxy for both cost and correctness of the feature. For example, a lower than expected token count is a signal that the LLM is providing a generic “I don’t know how to answer this” message, while a higher than expected token count is a signal that the LLM inference could use a better stop sequence. Some multimodal models count images via tokens while others via a discrete image metric - the Firebase Genkit Monitoring dashboard supports both.

Feature-specific telemetry
While the overview page provides a great high-level view, clicking on a specific Genkit feature that you’ve built brings up its details page with more granular telemetry and higher fidelity graphs. Want to know when your latency shot up or when the token usage increased? This page has you covered!
Tools to identify and debug issues
To understand and debug the root cause of problems, you need more than just metrics. This is especially true given Genkit’s capabilities to construct complex, multi-step AI features.
The Firebase Genkit Monitoring console makes debugging complex flows simple. The failed paths table displays all failed fragments of your Genkit feature, allowing you to quickly identify where in your code an error occurred. You can then use the traces table to filter into the specific failed invocations and quickly view trace attributes, including status, input, output, latency, and model set. These traces can be exported and used for evaluations directly within Genkit, facilitating feature iteration and improvement - this is especially useful in cases where getting a dataset during feature development is impossible or very difficult.


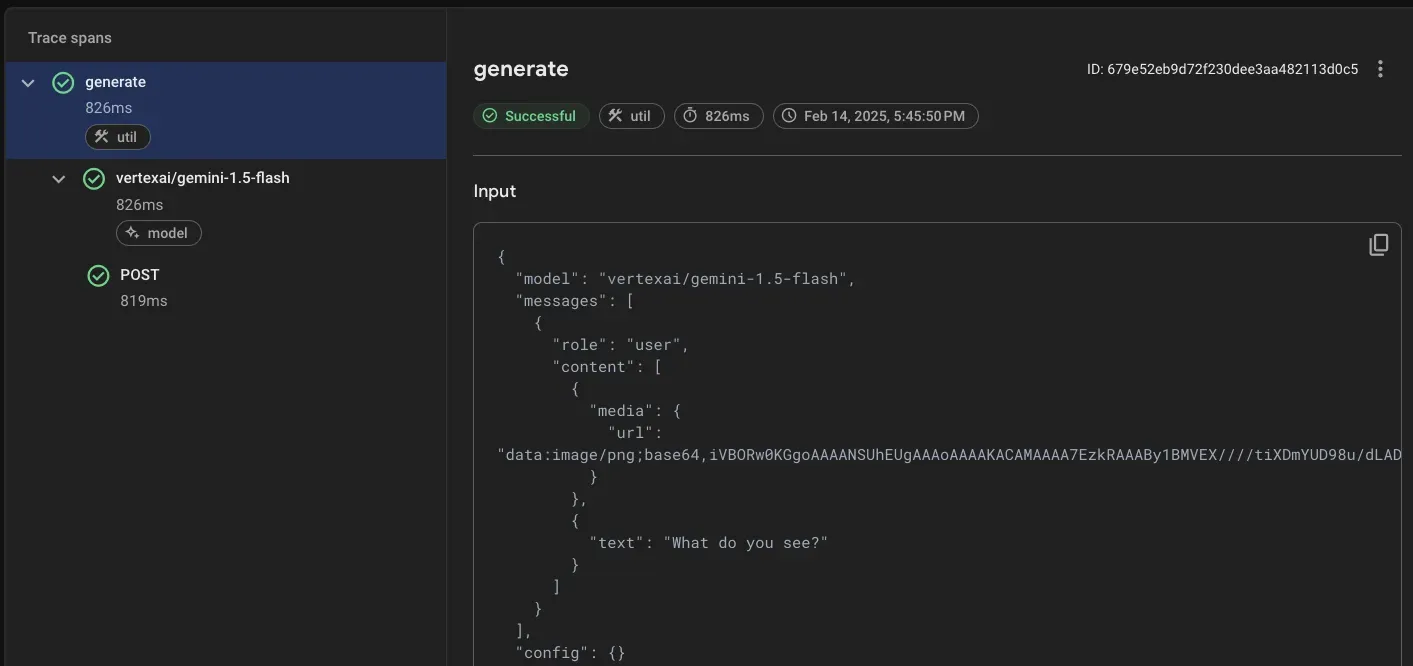
Debugging errors and quality-of-results issues requires a detailed view of each execution because the most interesting parts may be hidden inside.
Clicking a trace gives you a detailed view that allows you to explore each span in your Genkit feature and its respective attributes, including input and output. The trace viewer provides an intuitive and easily navigable view of the trace that helps you find exactly where in the flow the feature went awry. And in case you need to dig deeper or join with other application data, all trace, log, and metrics data is stored in GCP and can be accessed there!
The combination of the high level metrics and low level trace debugging capabilities of the Firebase Genkit Monitoring dashboard help you quickly identify and fix emerging issues, improve your features, and ultimately keep your customers happy.
Check out the Get Started with Genkit Monitoring documentation for our complete instruction guide.
Got questions or feedback? Join us on our Discord server. For feature requests and bug reports, hit us up on the Genkit GitHub issue tracker.