
Debugging native crashes on Android is easy! Just kidding, it’s hard. A large part of what makes it hard is the lack of symbolicated system frames, especially in the more complicated cases. Luckily, Crashlytics has made improvements to provide a richer view of both system and application frames to make debugging these situations easier.
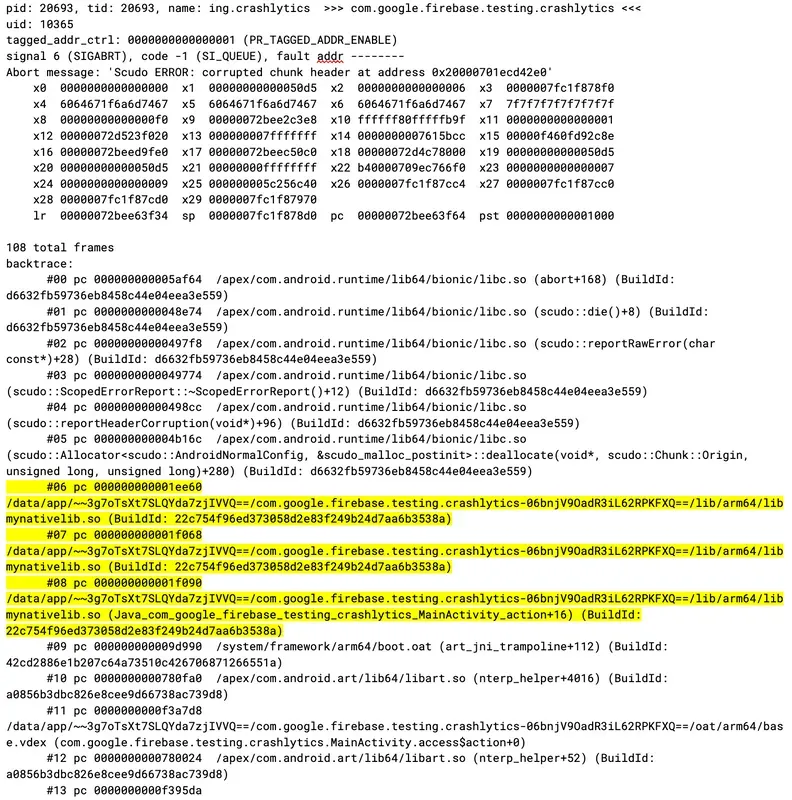
If you’ve spent enough time in native Android, you most likely have encountered
stack traces that include unsymbolicated system frames from libraries such as
libc.so and libart.so.
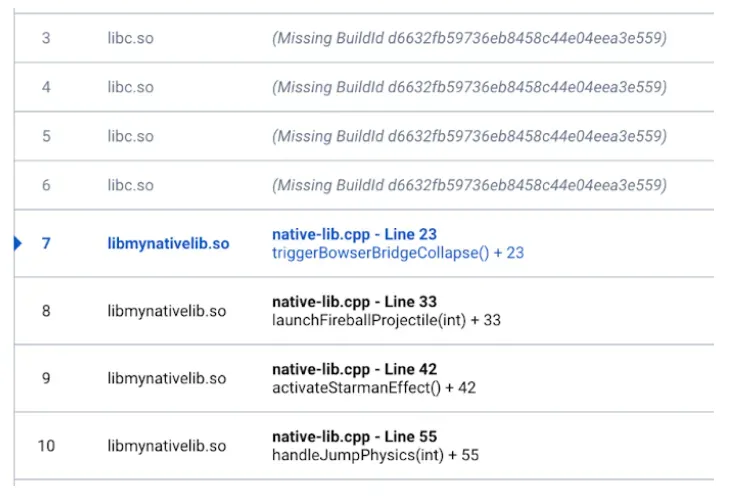
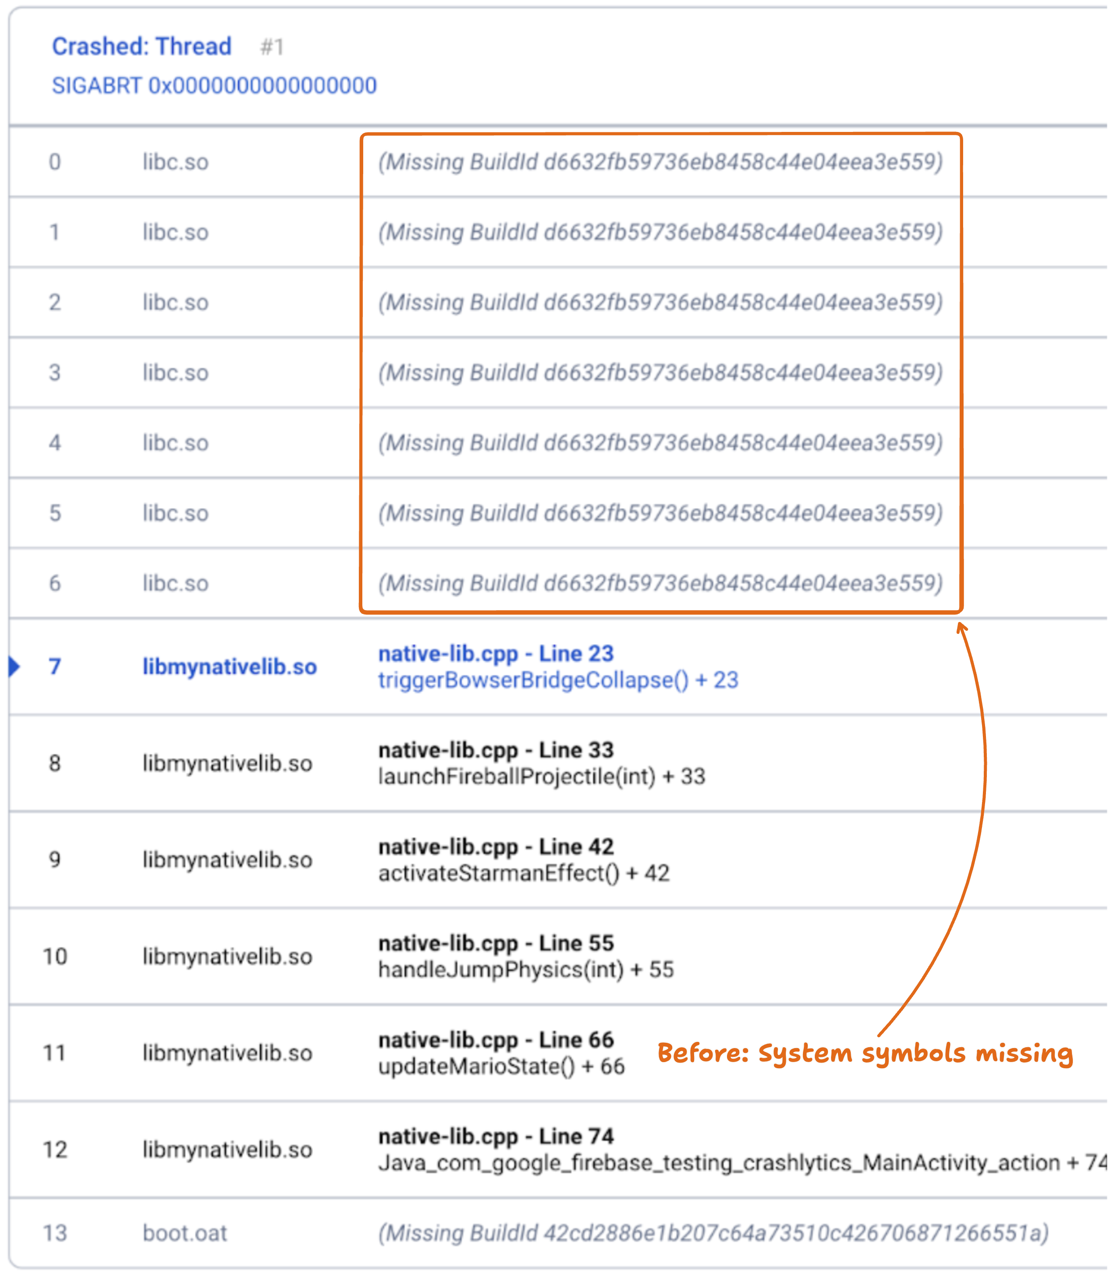
While Crashlytics gives you a high fidelity view of application frames, the system frames show up as raw pc addresses not suitable for human consumption.
Crashlytics achieves high fidelity within app frames by collecting native crash data as minidumps. A minidump is a lightweight snapshot of the app state that the Crashlytics NDK SDK captures using the Crashpad client. The minidumps are processed and unwound on the Firebase backend and your app’s frames are symbolicated using the symbols files that were uploaded using the Crashlytics Gradle plugin at build time.
Unfortunately, the uploaded symbol files only contain the application symbols. This creates a critical problem: we don’t have symbols for every version of every system library used across all Android devices. To symbolicate these frames perfectly would require a massive, comprehensive repository containing every version of every system library from every device build. The combination of all versions is too intractable to support.
We have taken advantage of core Android functionality to fill this gap and make your life easier - this is where Tombstones come in.
Now, the minidump and tombstone give you a more complete picture of the problem making it easier to debug and fix native crashes in your Android app.
What are tombstones
Tombstones are crash reports generated directly on the device when a native crash occurs. Starting in version 18.3.6, the Crashlytics NDK SDK collects tombstones on devices running Android 12 (API level 31) and higher.
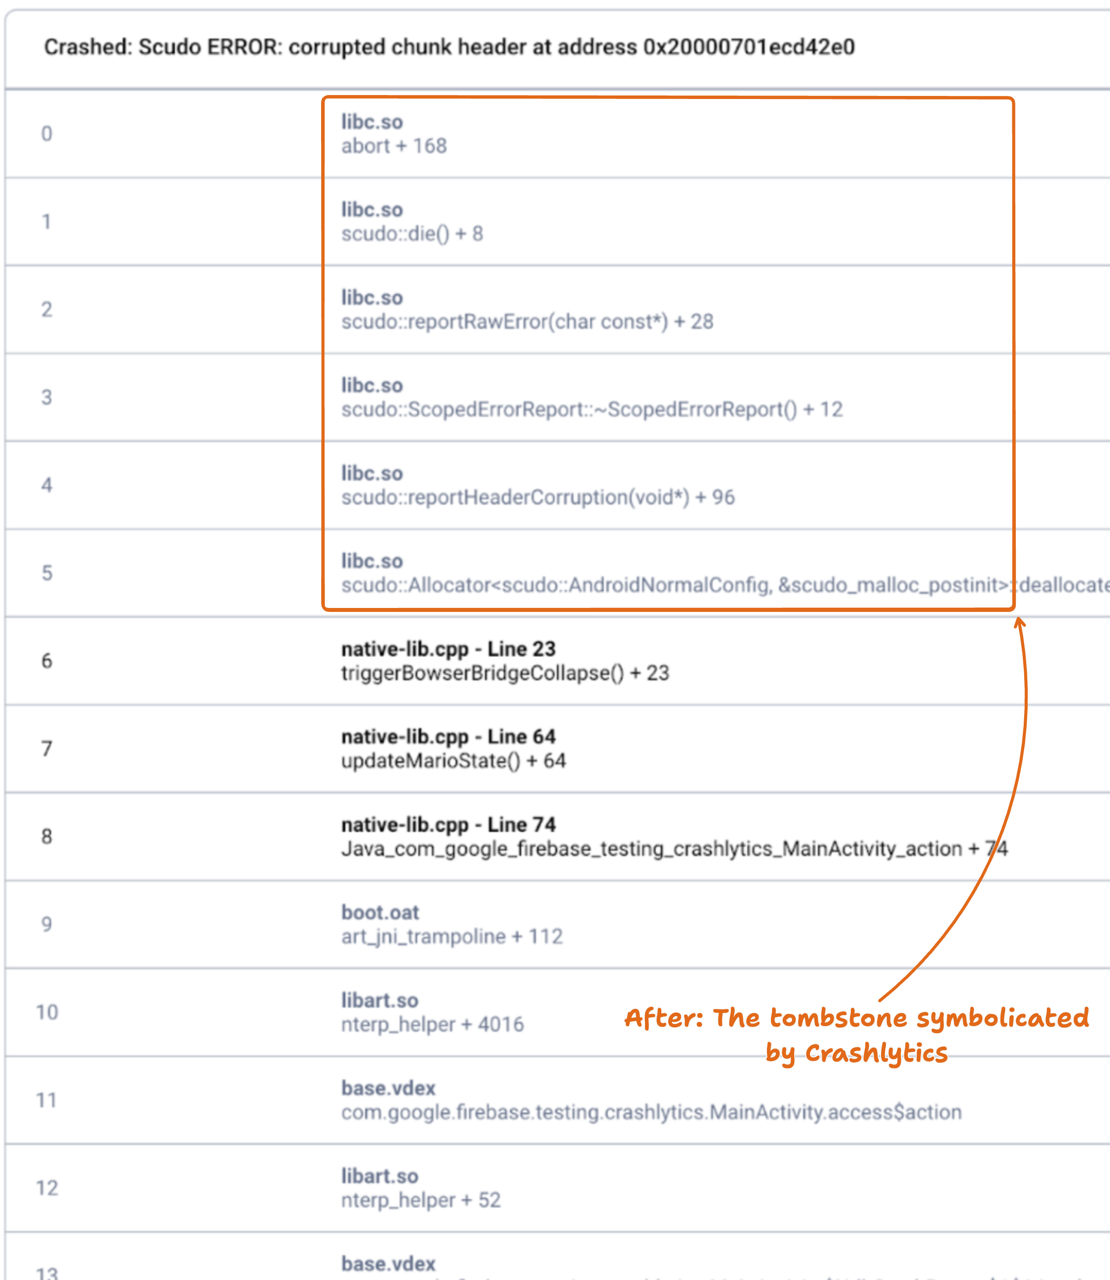
An interesting property of tombstones is that they include on-device symbolication. Unlike minidumps, which are processed on our backend, tombstones include symbols for system libraries. Android ships system libraries with embedded debug symbols that facilitate symbolication right out of the box.
Symbolicated system frames oftentimes provide the critical insight into the actual cause of the crash, especially in highly optimized use cases like games or media apps.
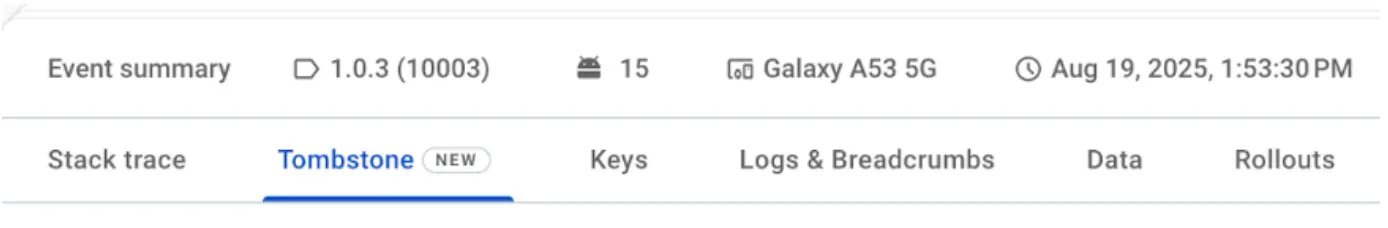
When a native crash occurs, we now collect and process both the minidump and the tombstone. Crashlytics will display both stack trace views side-by-side on the Crashlytics dashboard, and export both views to BigQuery (if enabled).
Tombstones come with a tradeoff in that they don’t contain app symbols. In the majority of cases, release builds have symbols stripped out of the binary. In cases of highly optimized code, tombstones lack the necessary fidelity within app frames that enable effective debugging of the problem.
How we made tombstones more readable
Before this update, getting a complete picture of a native crash meant extra
work. You may have needed to couple the Crashlytics console with the raw
tombstones using the
ApplicationExitInfo#getTraceInputStream()
API to get a full view of the crash context. Or, if you are an advanced user,
symbolicate it yourself to get app frames. While possible, this is not the best
workflow. Crashlytics now just does this for you for free!
Instead of the Crashlytics dashboard showing you a raw tombstone with application symbols missing, we run it through our symbolication pipeline (the same one we use for minidumps) to fill in your app frames with symbols, file names, and line numbers. The result is a rich, symbolicated stack trace, both for your app code and system libraries.
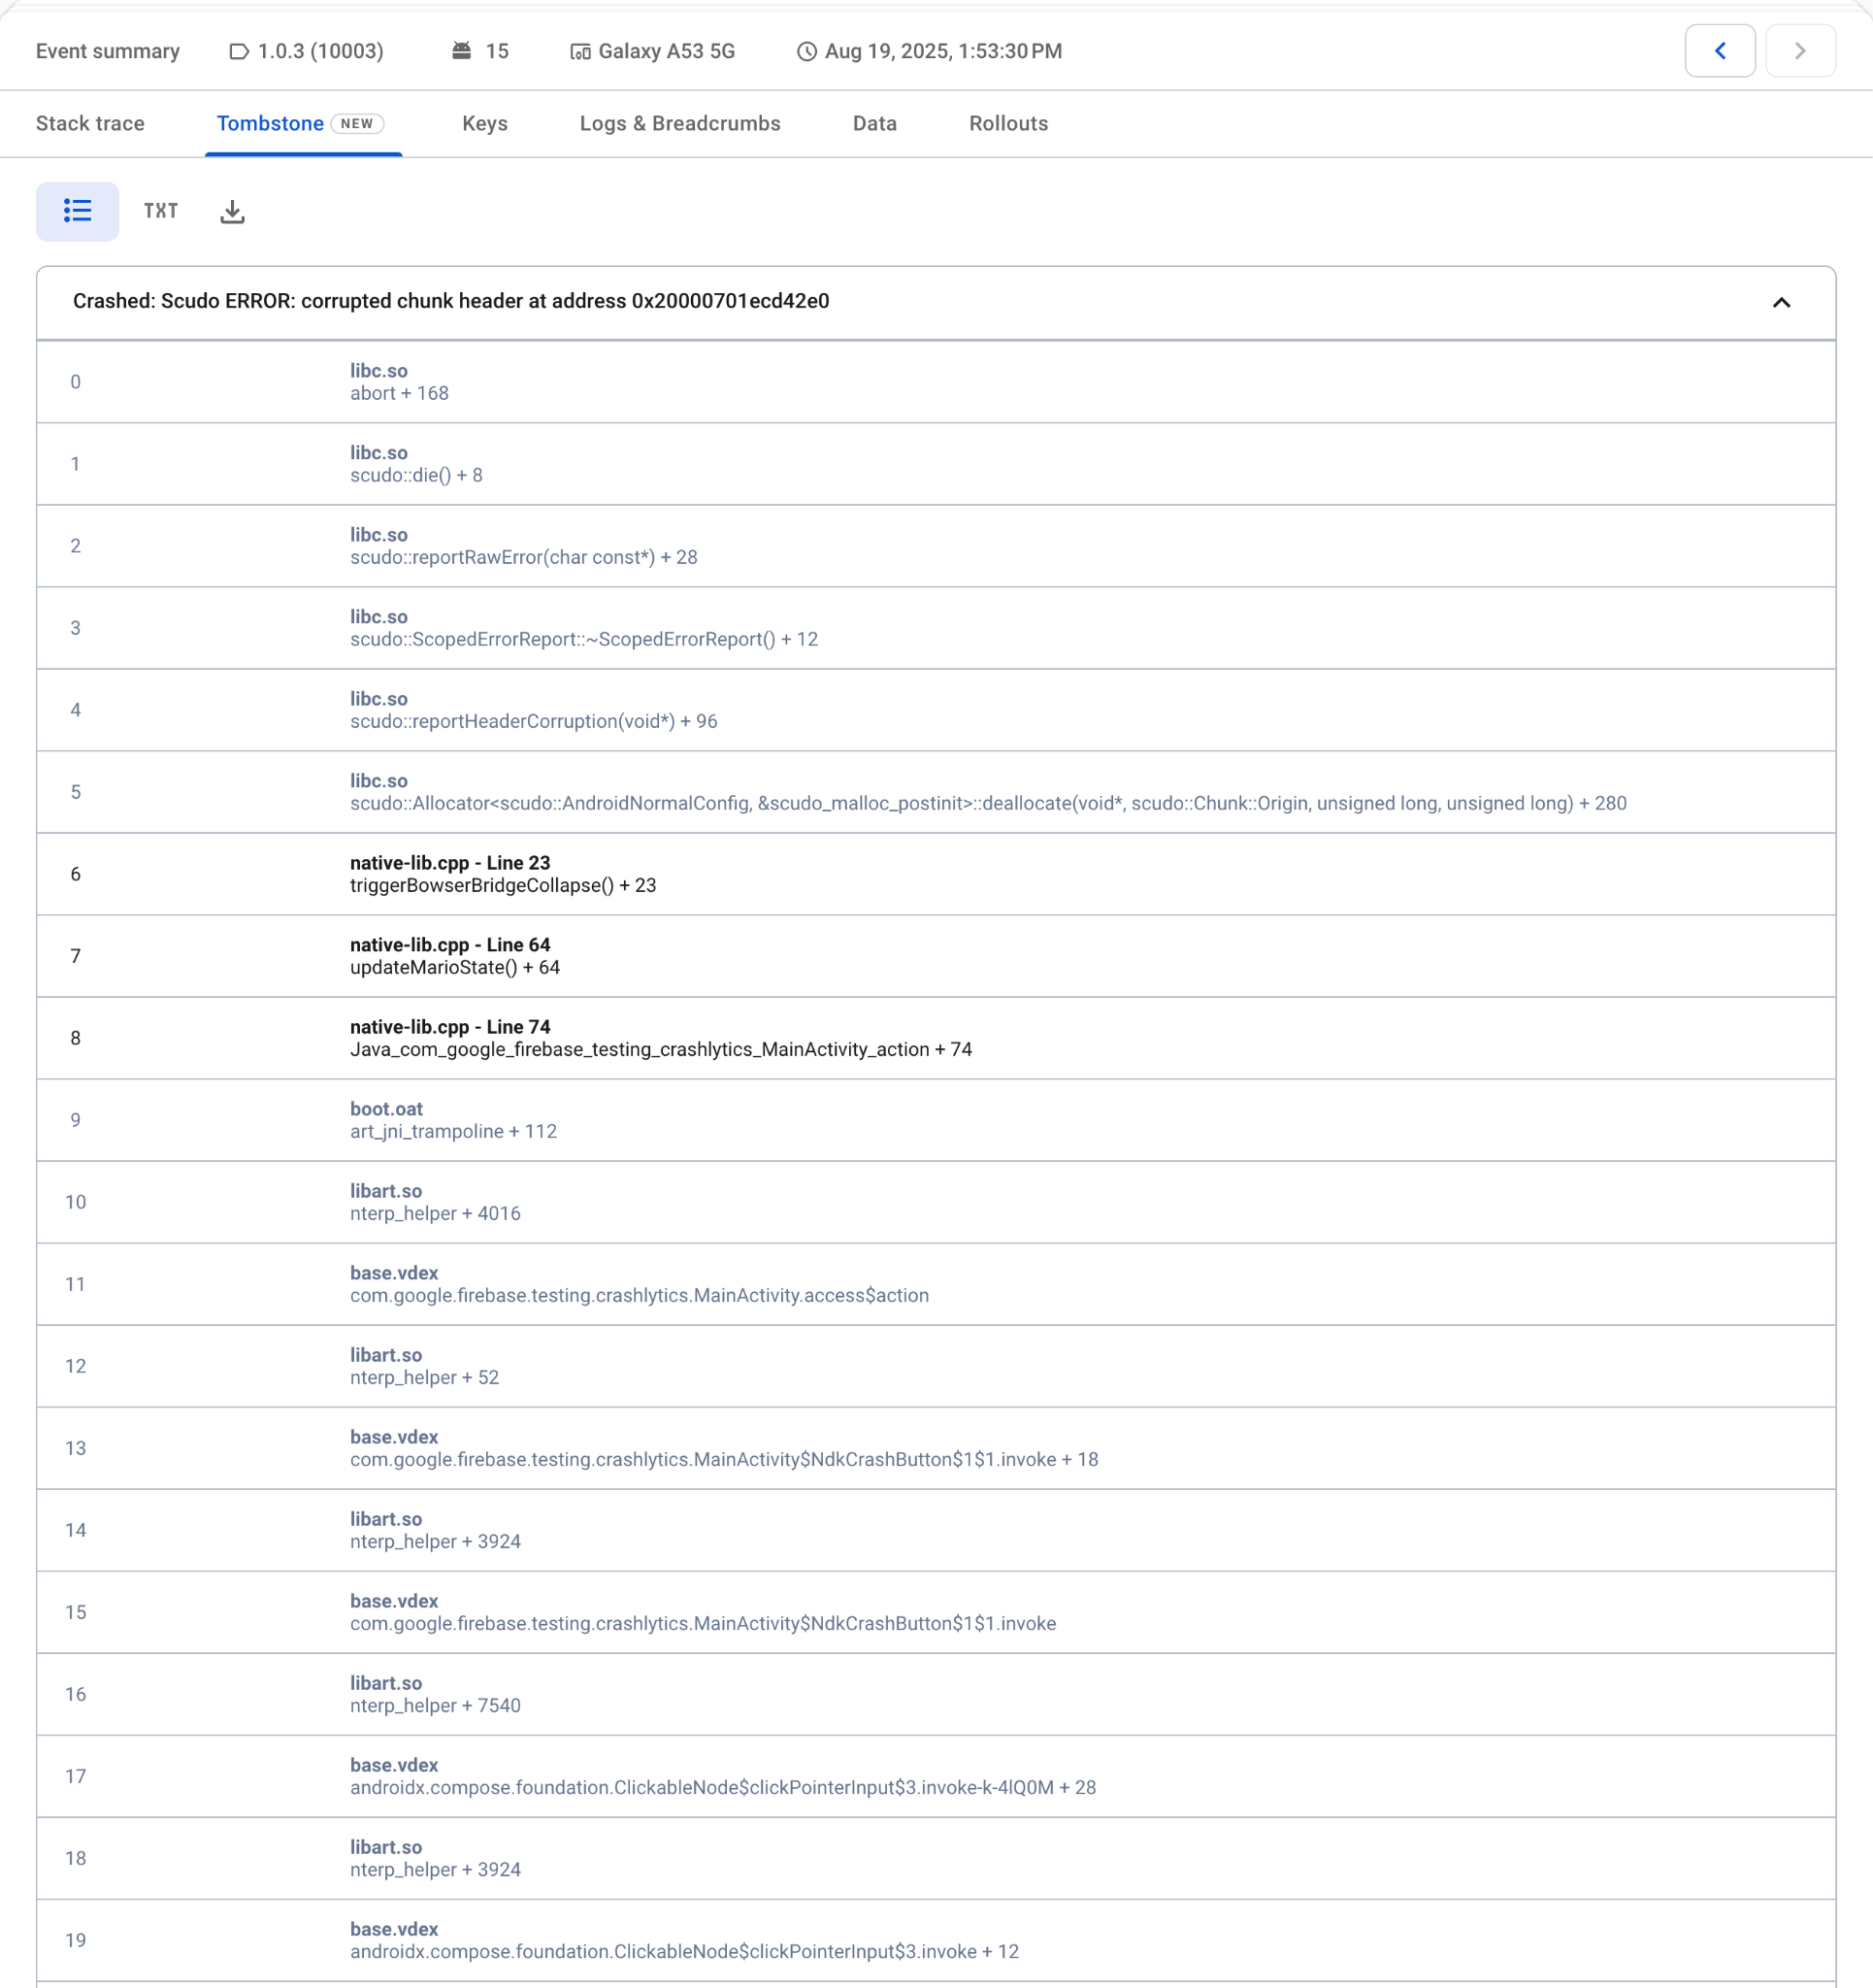
Harness the power of both minidumps and tombstones for comprehensive crash analysis. While minidumps often provide clearer stack traces, tombstones are crucial for uncovering deeper system-level issues, ensuring you never miss a critical detail.
What’s next
We’re continuing to invest in improving the quality of service of native crash reporting in Crashlytics to give you the best possible experience. Stay tuned for more improvements, and let us know what you want to see next!