

AI agents are great for building apps, but at Firebase, we know that the work continues after you ship your mobile app. As it turns out, AI makes an excellent partner for debugging and fixing crashes. With Gemini CLI and our new Firebase Crashlytics Model Context Protocol (MCP) tools, we’re expediting the debugging experience. This transforms the complex and time-consuming process of digging through stacktraces, code, and other resources to instead be conversational by leveraging Gemini CLI (or your AI development tool of choice) to answer your questions and propose solutions – and even implement the fixes for you!
In case you are unfamiliar, Firebase Crashlytics is a mobile crash reporting service for Android, iOS, Unity, and Flutter apps, collecting and providing information on crashes and errors that are impacting your end users.
The Firebase Crashlytics MCP tools let your AI powered development tools (like Gemini CLI, Claude Code, or Cursor) access Crashlytics data within the context of your codebase. This enables you to work with your AI tool to understand, debug, and quickly fix your crashes – saving you valuable time and improving your end user experience!
In this guide, we’re going to walk you through how to use these MCP tools with Gemini CLI.
Prerequisites for using Crashlytics MCP tools
Here are some prereqs for using these features:
- A mobile app that’s using Crashlytics
- Crashes, ANRs, or non-fatal issues present in your Crashlytics dashboard
- Access to your app’s codebase (for example, from a local machine or VM with terminal access)
- A working installation of Node.js and npm
Install the Firebase extension for Gemini CLI
To get started, first install the Gemini CLI. If you’re not sure which authentication option to use, just start the Gemini CLI, and it will guide you through signing in with your Google Account. This method of authentication is adequate for most developers, particularly if you’re just starting out with the Gemini CLI.
Install the Gemini CLI globally:
# Option 1: Install globally with npm
npm install -g @google/gemini-cli


# Option 2: Install globally with Homebrew (macOS/Linux)
brew install gemini-cli
Next, install the Firebase extension for Gemini CLI:
gemini extensions install https://github.com/gemini-cli-extensions/firebase/Finally, verify that it installed correctly by starting Gemini CLI. Navigate to the directory for your code and then run the command gemini:
cd ~/my-awesome-repo
gemini
You should see the Gemini CLI start up with some ASCII art and a message that shows you which GEMINI.md files and how many MCP servers are connected.
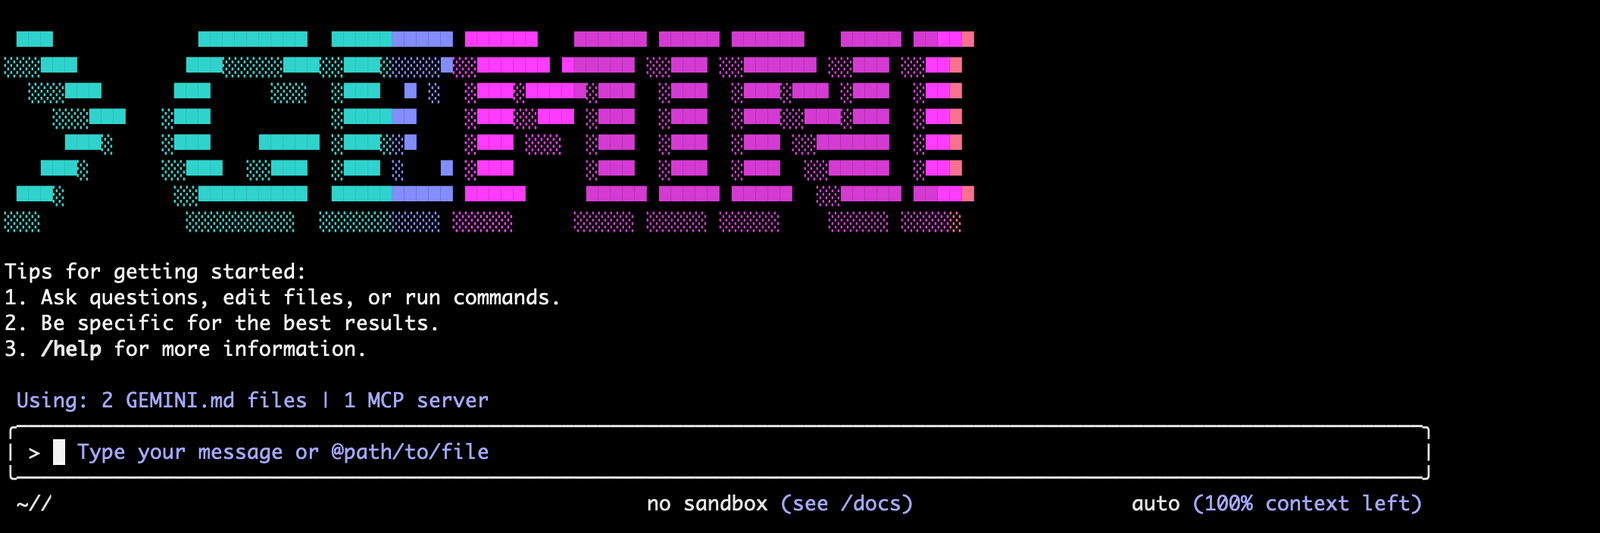
Now you’re ready to start prioritizing and fixing issues!
Run the /crashlytics:connect command
Time for some debugging fun! To get started with the guided flow, run the /crashlytics:connect command:

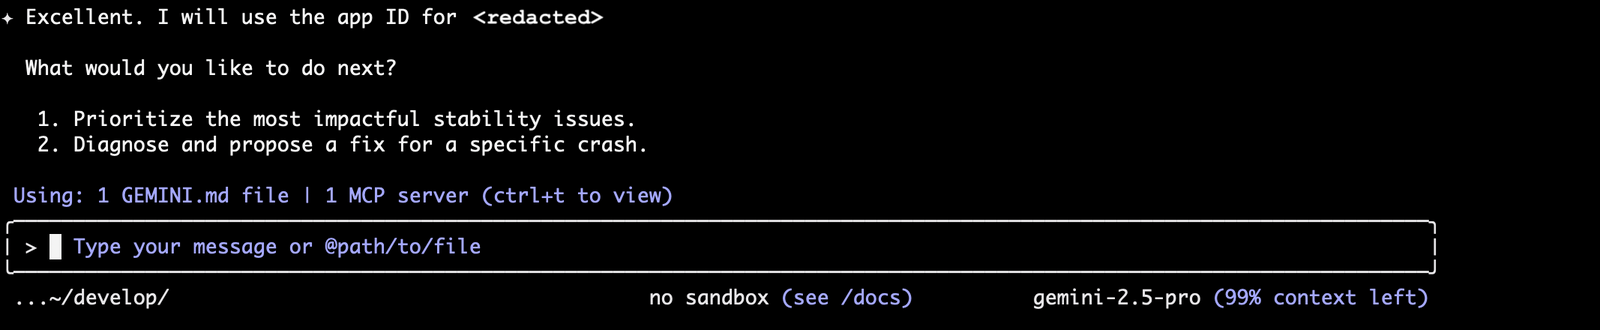
This command primes the Gemini CLI with appropriate context for a guided workflow to prioritize, investigate, and fix issues. It first collects necessary information to interact with the Crashlytics API, checking your login status and finding relevant app IDs in your codebase. Then, it gives you two options: prioritize issues or diagnose and fix an issue.
Find important issues
Maybe you’ve had some customer reports about crashes on tablets. You can just ask something like: “What are my top issues on tablets in the last week?”
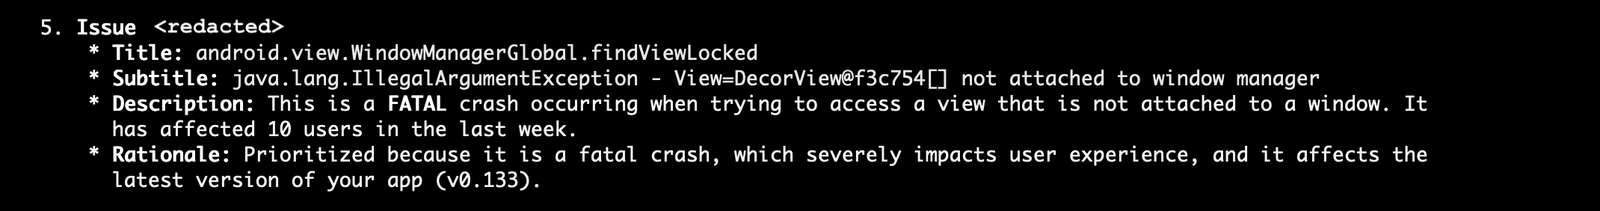
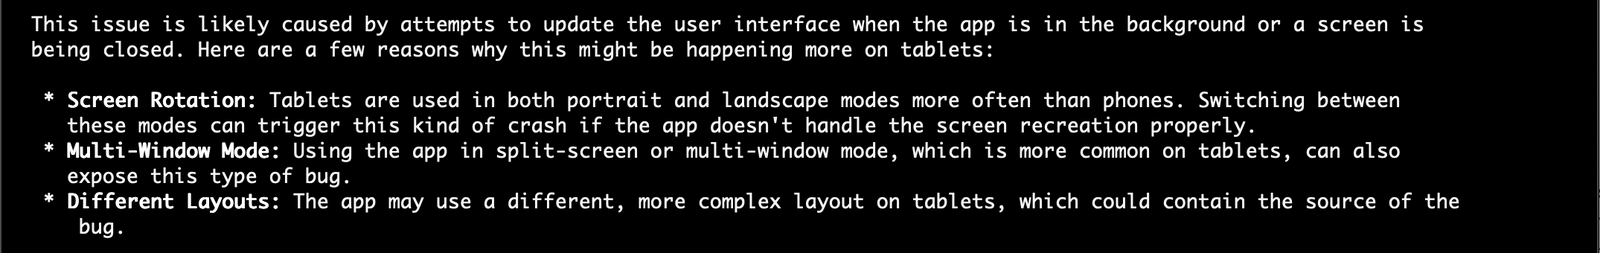
Gemini CLI can use filters on the Crashlytics API to find crashes specifically related to tablets. By default, it returns the top 5 issues, but you can change that criteria to meet your needs like asking for it to return more issues or exclude non-fatal issues.
Here’s one of the issues returned from that query:
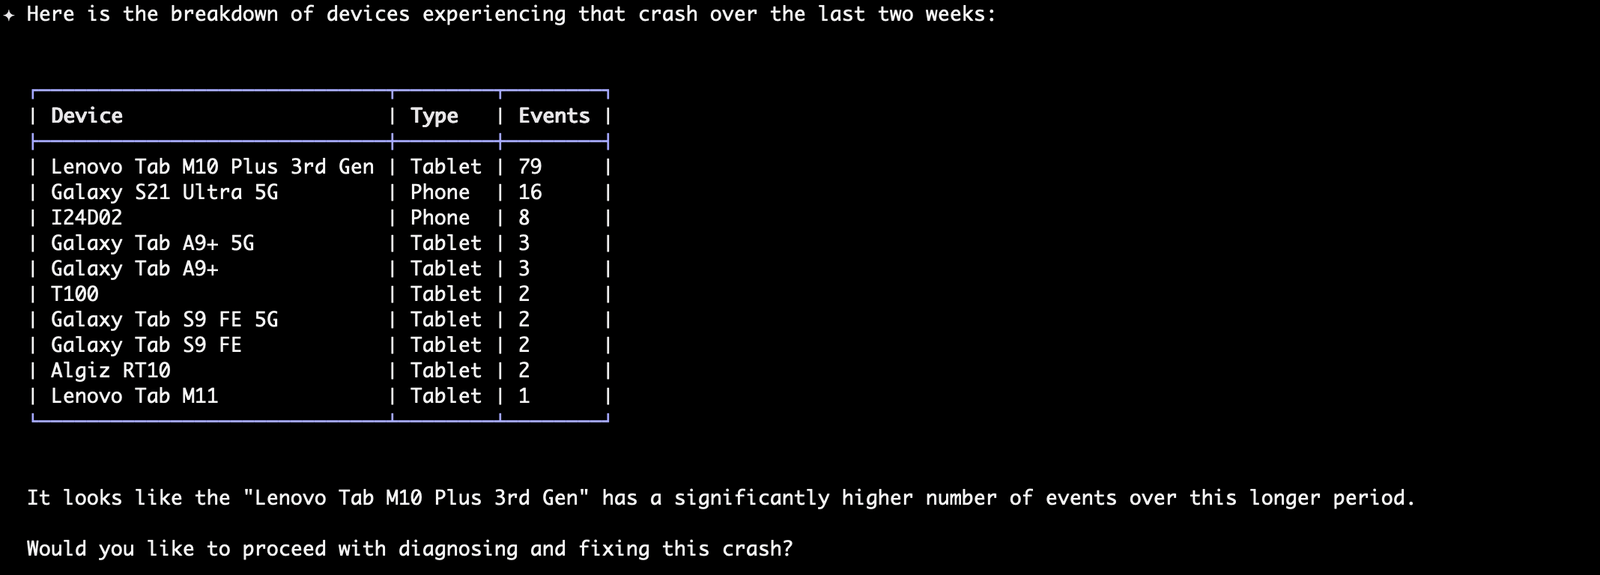
As part of the investigation, you can ask clarifying questions or ask for more information. For example, you might want to know whether this crash is happening primarily on tablets or on all devices, so you could ask something like “What devices is that crash happening on?”
Investigate an issue
You can dive deeper into a single issue like the example with the tablet issue. Gemini CLI can fetch sample events for this specific issue and use that information in conjunction with your codebase to come up with a proposed root cause and solution.
Here’s an example conversation you could have with Gemini:


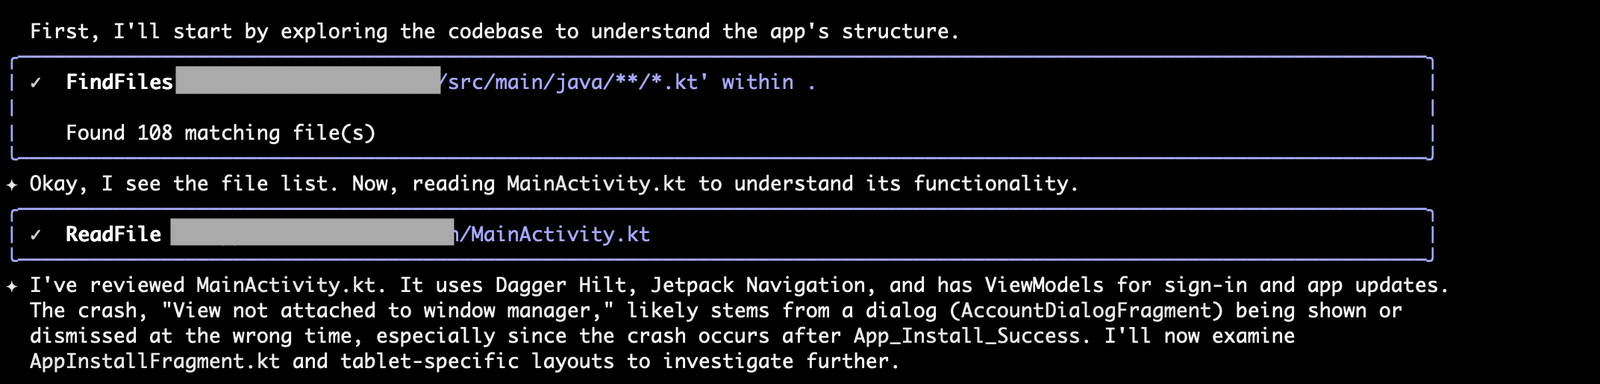
Gemini CLI goes on to investigate several different code paths before returning a detailed report.
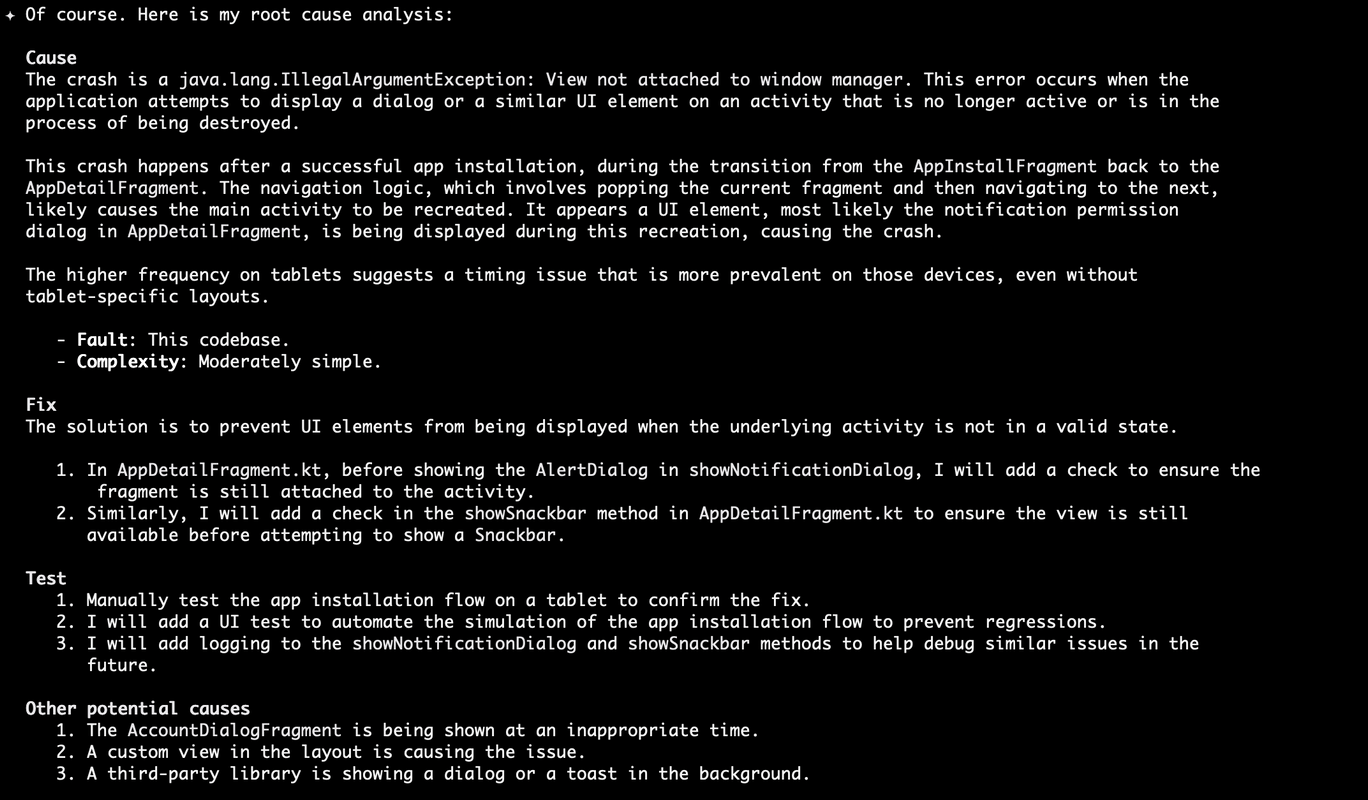
With issues like this, it can be difficult to pin-point which activity is the likely cause. This is something where traditionally, it could take hours to scour the code and the stack traces to figure out which class is the culprit. But Gemini CLI was able to analyze the codebase in minutes, saving you time and headache in switching between the Firebase console and your codebase.
Using Firebase Crashlytics MCP tools with Gemini CLI, we were able to use the vast knowledge of the Android ecosystem and common patterns and the app’s codebase, along with real world Crashlytics data to help debug a tricky issue through a conversational flow. From this point, you can interrogate the solution further, pick up the investigation yourself and try to reproduce the issue, or, if you feel confident, send Gemini CLI off to draft a fix.
Summary
Our goal with the Crashlytics MCP tools in the Gemini CLI is to make your life easier.
We’re taking the complex, multi-step process of debugging—identifying, prioritizing, investigating, and fixing—and condensing it into a streamlined, conversational journey. By connecting the power of a model like Gemini directly to your Crashlytics data via MCP, you get AI-powered assistance that saves you time, reduces context switching, and keeps you focused on your code.
Ready to experience the future of debugging? Launch the Gemini CLI (or your AI coding tool of choice) and use the command /crashlytics:connect to get started with your new debugging buddy! We’re excited to hear what you think!
Resources
Learn more about the Crashlytics MCP tools in our official docs to get started.
Learn more about Firebase MCP offerings to get even more out of Gemini CLI (or your AI coding tool of choice) with all your favorite Firebase products.
Learn more about Model Context Protocol (MCP) from the official docs.