---
title: "Crashlytics for web is now in public preview"
description: "Firebase Crashlytics now supports web apps: JavaScript error monitoring for Next.js, React, and Angular, with stack traces that point to the exact line."
published: "2026-11-19"
last_updated: "2026-11-19"
authors:
- "Jeff Huleatt (Developer Relations Engineer)"
- "Jennifer Wolfson (Product Manager)"
categories:
- "Crashlytics"
- "Web"
- "Next.js"
- "React"
- "Angular"
- "Cloud Observability"
- "Agent Skills"
canonical_url: "https://firebase.blog/posts/2026/11/crashlytics-web-public-preview"
---
# Crashlytics for web is now in public preview
_Monitor and fix JavaScript errors in Next.js, React, and Angular apps_
*Published November 19, 2026 by Jeff Huleatt (Developer Relations Engineer), Jennifer Wolfson (Product Manager)*
---
Thanks to coding agents, shipping a web app has never been faster. Tools like Antigravity and Google AI Studio can build and deploy new features in minutes. But how do you make sure a feature is actually stable in production? Tests may pass, server logs may show everything is fine, but none of that matters if JavaScript is crashing in the browser.
Crashlytics for web, now in public preview, can alert you when a new JavaScript error appears or a fixed one comes back, and points to the exact spot in your codebase where the crash is occurring, just as it has for Android and iOS apps for years.
### How it works
Crashlytics for web is built on [Google Cloud Observability](https://g.dev/cloud/observability-crashlytics-web) and OpenTelemetry. This means you can see crash logs right next to your server logs (like from Cloud Run), so you can debug the full stack in one place. And if you already use [Error Reporting](https://g.dev/cloud/error-reporting-grouping-crashlytics-web) for your backend, your web errors show up there too, grouped into the same issues you see in Crashlytics.
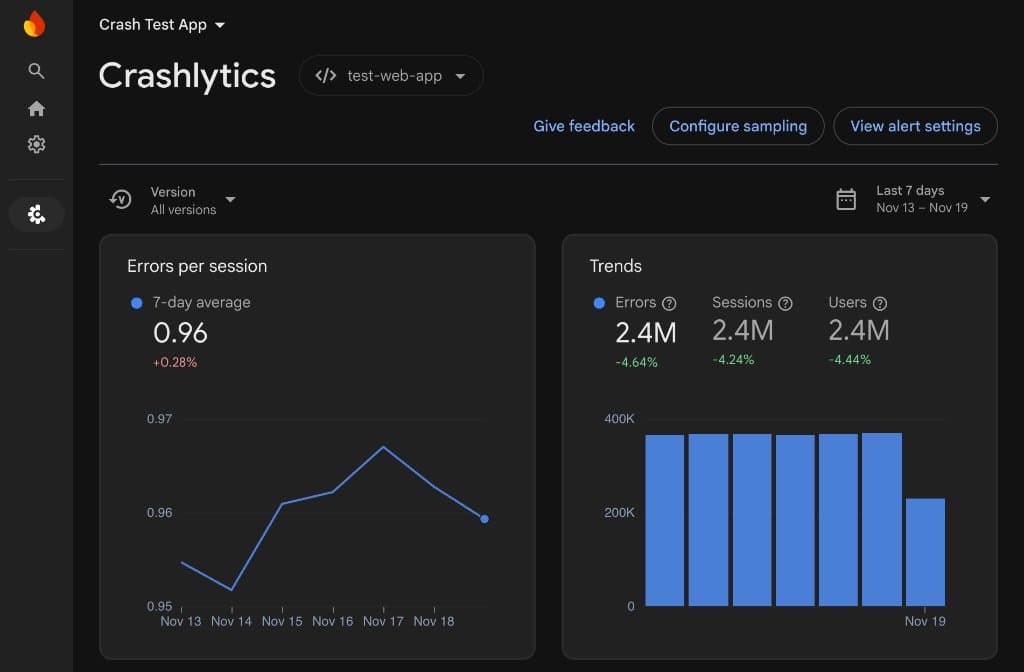
Because it's built on Cloud Observability, Crashlytics for web requires the pay-as-you-go Blaze pricing plan, with a generous no-cost tier. You can also [adjust the sampling rate](https://g.dev/firebase/crashlytics-web-configure-sampling) to control telemetry volume and cost.
If you've enabled [Cloud Logging export for Crashlytics](https://firebase.blog/posts/2026/01/crashlytics-export-cloud-logging/) for your mobile apps, then you'll already be familiar with Crashlytics' integration with Google Cloud Observability and can view all your web and mobile logs in Cloud Observability.
### Lifecycle of a crash report
You just shipped a new feature in your app. Everything seems fine, until...
#### Receiving an alert
Your email pings with an alert about a new issue: a JavaScript error that is affecting real users.
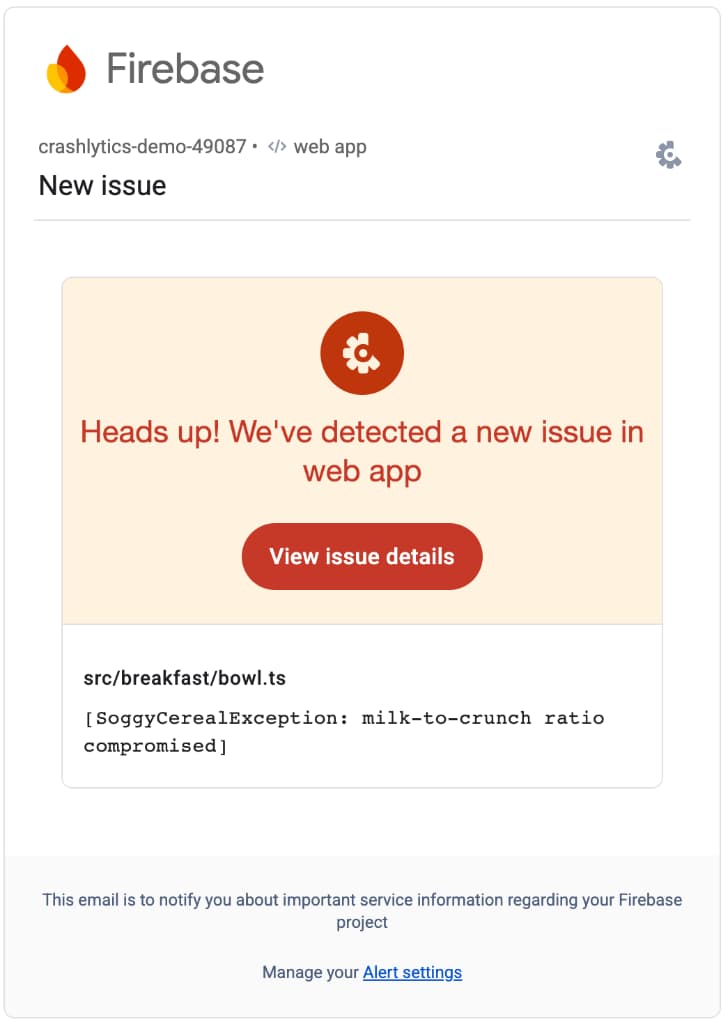
> **Note:** Web alerts are off by default, so [turn on email alerts](https://g.dev/firebase/crashlytics-web-email-alerts) for new issues and regressions (closed issues that come back) to get emails like this one.
#### Debugging
You follow the link from the alert into the Firebase console:
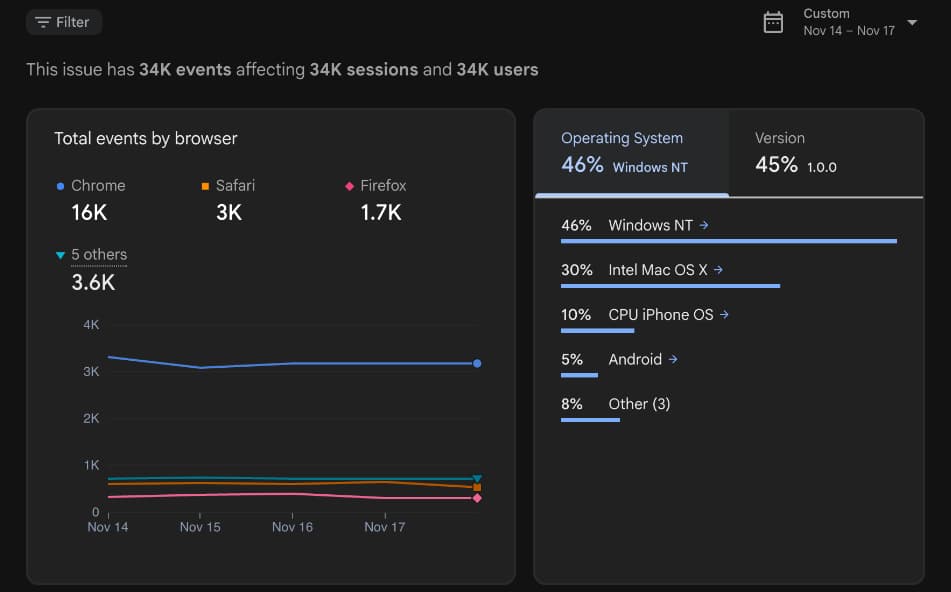
Further down the page, Crashlytics shows the exact line where the error occurred, for each affected session:
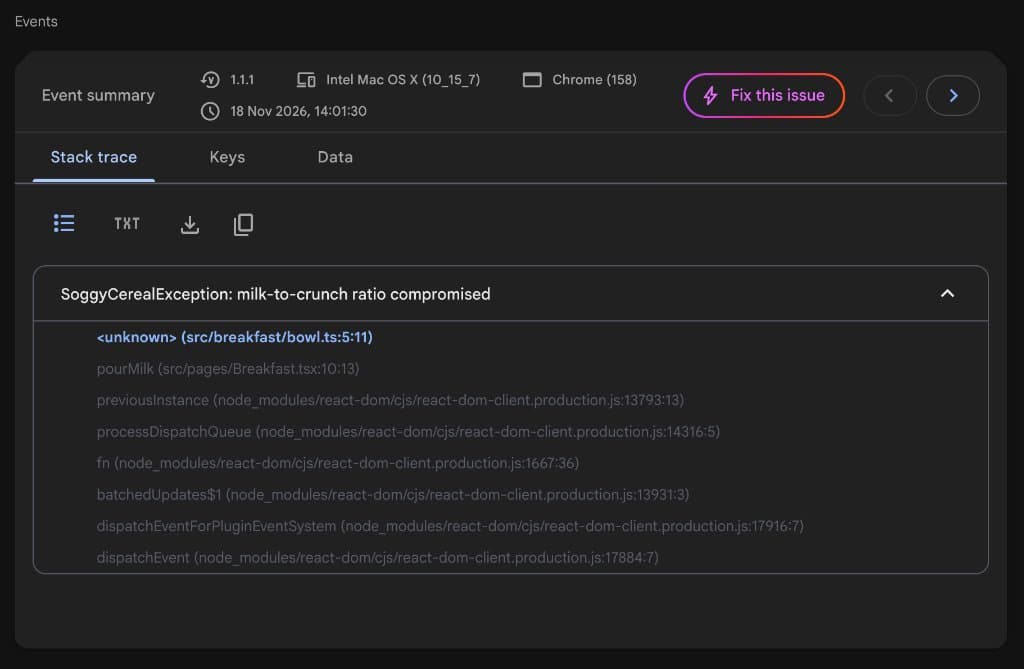
From there, you can debug the issue yourself or [ask your AI coding agent to investigate it](https://g.dev/firebase/crashlytics-web-ai-assistance), then ship a fix.
### Integrate into your Next.js, React, or Angular web app
You can set up Crashlytics in the Firebase console, with the Firebase CLI (`firebase crashlytics:setup`), or with [agent skills](https://g.dev/ai/agent-skills). Crashlytics has integrations for Next.js, React, and Angular. If you use a different JavaScript framework, you can [report exceptions programmatically](https://g.dev/firebase/crashlytics-web-log-exceptions) where your framework handles errors.
In a React app, mount `` near the root to register global `error` and `unhandledrejection` listeners:
**`src/App.tsx`**
```tsx
import { initializeApp } from 'firebase/app';
import { FirebaseCrashlytics } from 'firebase/crashlytics/react';
const app = initializeApp(firebaseConfig);
export default function App() {
return (
<>
);
}
```
The [get started guide](https://g.dev/firebase/crashlytics-web-automatic-error-capturing) has setup code for Next.js, React Router, TanStack Router, plain React, and Angular. With React Router, Crashlytics records the route template (for example, `/profile/:userId`) with each error, so it's clearer where an error comes from.
#### Upload source maps for helpful stack traces
If your web app's build has a compilation or minification step, the error message and line number reported in a crash wouldn't be too useful for debugging. To fix this, you can upload source maps to Crashlytics using the Firebase CLI.
Once source maps are uploaded, you'll be able to see original file names and line numbers in your error reports.
```bash
firebase crashlytics:sourcemap:upload --app FIREBASE_WEB_APP_ID --clean dist
```
The `--clean` flag automatically deletes the local source map files after uploading (if you're worried about shipping source maps to production).
### Start monitoring crashes today
Take a look at the [Crashlytics docs](https://g.dev/firebase/crashlytics-web-get-started) to get started today. Remember this is the public preview stage, so we're especially interested in hearing how it goes for you. We've already implemented lots of changes based on private preview feedback, and we hope you'll let us know what you think on [UserVoice](https://firebase.uservoice.com/forums/948424-general?category_id=464887) or [GitHub](https://github.com/firebase/firebase-js-sdk/issues).