
Checkout the video guide
The Firebase Realtime Database has traditionally been a black box that doesn’t really give you a lot of insight into its performance. We’re changing that. Today, you’ll be able to get insights into how your database instance is performing by using the profiler built into the Firebase CLI. You can now easily monitor your database writes and reads at the path level, collecting granular data on bandwidth usage and speed.
To start, make sure you have the latest version of the Firebase CLI installed and initialized. Start profiling using the database:profile command.
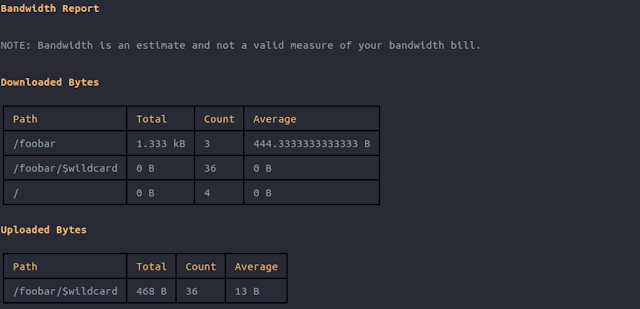
firebase database:profileThis will start streaming operations from your Realtime Database. When you press enter, the CLI aggregates the collected data into a summary table broken down into three main categories: speed, bandwidth and unindexed queries. Speed and bandwidth reports are further broken down by the operation type (write or read) and the path in your Realtime Database. If you have a location with more than 25 children (for example, if you’re using .push in the SDKs), the summary table collapses those paths into a single entry and replaces the push ids with $wildcard.
Speed
This table displays 4 items: the path, the number of times that location has been hit, the number of milliseconds it took for the server to process the request, and the number of times that the path has been denied by rules.
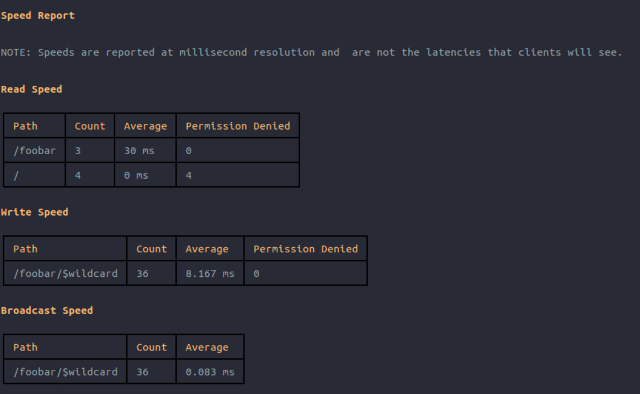
Bandwidth
The table displays 3 items: the path, the total amount of bandwidth for the path, and the average bandwidth per operation.
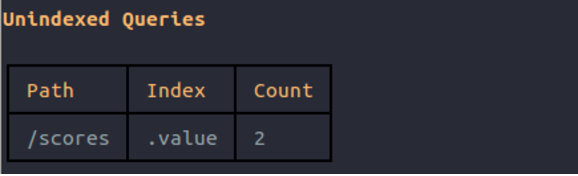
Unindexed Queries
This shows 3 things: the path, the index rule that should be added to your rules, and the number of times the location has been queried. Warnings for these queries also show up in the SDK logs.
What if this isn’t enough?
You can also collect the raw operations from your server by using the –raw flag (you’ll probably also want to specify an output file with –output), to get more detailed information like ip addresses and user agent strings for connected applications. See the profiler reference page for a complete list of possible operations you can collect information about and what they show.
Speeds are reported at millisecond resolution and refers to the time it takes for the database to process an operation. However, you may see vastly different latencies depending on network conditions and numerous other factors.
Bandwidth is an estimate based on the data payload and is not a valid measure of the billable amount. Values here could be over or under your actual billed bandwidth, and the stats sent by the profiler also count towards your bandwidth bill.