
When it comes to analytics, the sooner you can see your data, the quicker you can react to it, and the more valuable it can be. This has been at the front of our mind since launching Firebase Analytics, and we’ve been working hard to get you closer to that goal.
Back in November we launched real-time conversions. This meant that your most important events were delivered immediately from end-user devices. Around the same time, we also launched real-time export to BigQuery, so that your client events could be analyzed within BigQuery as soon as they were sent to our servers.
But for those of you not using BigQuery, you’d often have to wait several hours before you could start to see any meaningful results from Firebase Analytics. And when it comes to tasks like debugging analytics within your app, or just getting a quick snapshot of how your community is reacting to your latest changes, those hours can feel realllly long.
To address those needs, we are pleased to announce that StreamView and DebugView from Firebase Analytics are being rolled out to the general public.
StreamView visualizes events as they flow into Firebase Analytics, and gives you a general sense of how your users are interacting with your app. With StreamView you can find out if a brand new feature is as well-received as you were hoping, watch the roll-out of the latest version of your app, or gauge the response to your latest re-engagement efforts - all in real-time as events are received by Firebase Analytics.
StreamView can give you a sense of where in the world people are using your app, right down to the city level…

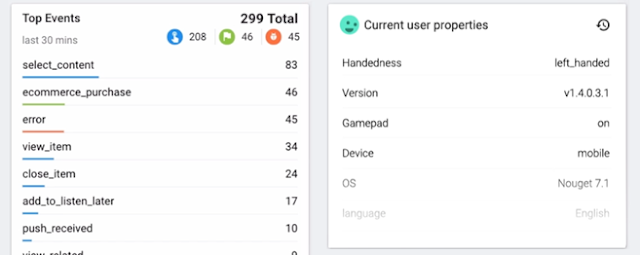
…or what user properties are most common among your users….
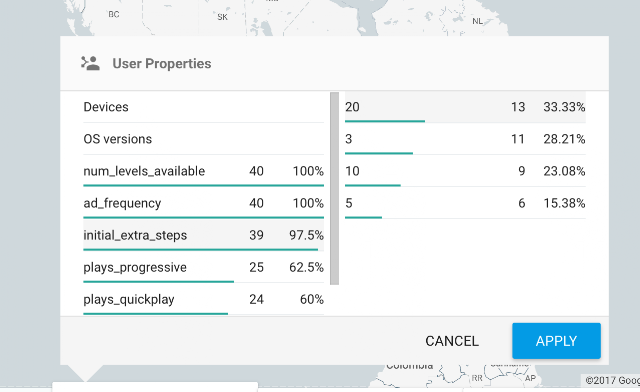
You can also get an overview of what kind of events are being triggered in your app, and for any of those events, you can see a breakdown of all the custom event parameters you’ve been recording…
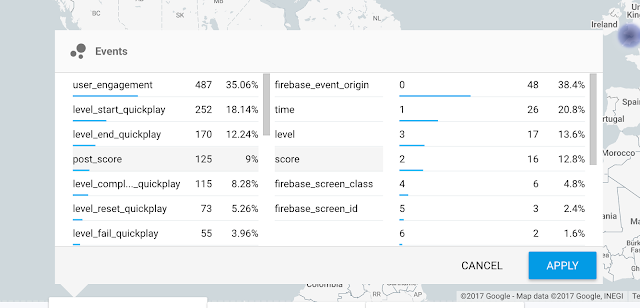
…and you can use all of these values as report filters to see where in the world certain events are occurring or certain products are popular, and you can see what user properties or events are common among users in certain countries or cities.
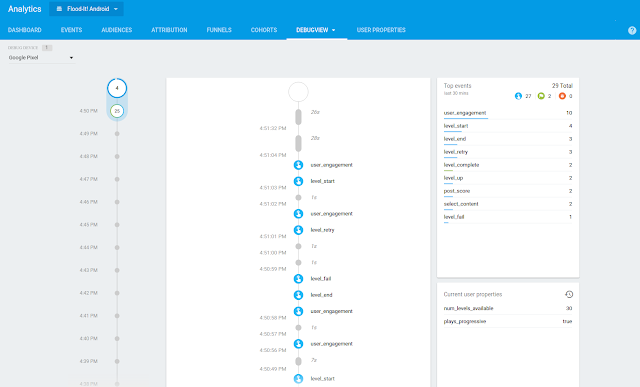
One unique feature available in StreamView is the User Snapshot. This will give you a live stream of the events from a random user. You can use the view to gain insight into the individual user journeys within your app.

Within the User Snapshot view you can see the set user properties, the user’s device and location, and drill into the parameters of the events they’re sending. You can filter the users included by their location and app version.
While you may still need to use BigQuery to get full and complete reports, or cross-reference certain sets data against others, there’s a surprising amount you can learn about your app just by following the events as they happen in StreamView. The Santa Tracker team was an early customer of StreamView and they’ve assured me that it’s (and this is a direct quote), “Pretty bad-ass.”
You can can check out StreamView right away in our Demo Project!
While StreamView is a great real-time picture of your app once it’s gone out to the general public, event delivery from device is still batched. This is great for users and battery optimization, but difficult when you’re developing your app and need to check right away if your analytics setup is correct!
With DebugView, you can immediately see which events are being reported to Firebase Analytics. This will be activated for any device for which you’ve turned on Analytics Debugging, and is great for making sure you’re logging the right events with the right parameters while you’re building your app.
DebugView shows you events, parameters and user properties for any individual development device. It can also highlight any events that contain invalid parameters, so that you can get those fixed before you publish your app.
To get started yourself, take a look at our documentation on DebugView, or just look for these features in your own project console in the coming days and try them out!