Monitoring performance from the end user’s point of view - both app code performance and network responsiveness/reliability - is a challenge for building great mobile apps. You have to be able to understand conditions that need improvement, in order to avoid user churn and negative reviews. Conversely, we have seen that 60% of 5-star reviews on Google Play mention speed, design or usability.
The biggest challenge in monitoring performance in native apps is understanding context. It’s not enough to know that users experience delays or that your animations are not running smoothly; you need to understand where in your app that happens. It’s also important to understand how those experiences differ for various countries, devices, OS levels, etc.
This is why we built Firebase Performance Monitoring for iOS and Android. It provides an SDK to capture and instrument performance metrics in production, and a console to gain insights about the data captured by the SDK.
Firebase Performance Monitoring provides two main features: traces and network activity monitoring. Let’s talk about traces first. Traces allow you to instrument parts of your app to know the duration of an action, as well as attach custom metrics to that action using the “counter” API. As an example, you might set up a trace for the time from starting an image load until the image is fully rendered on the screen, and track how many times you hit or miss the cache while loading images using counters.
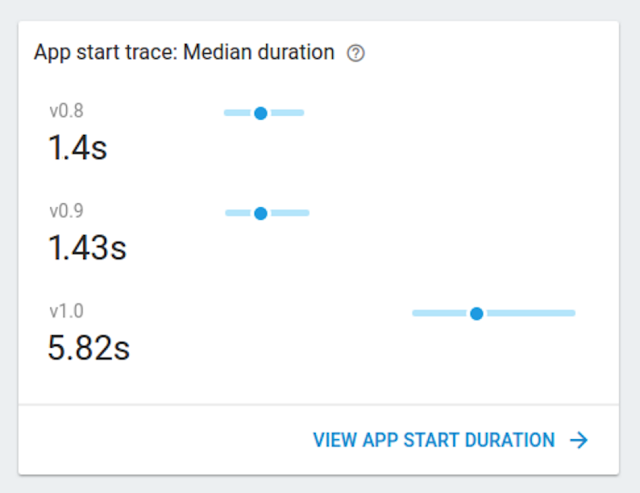
Just by installing the SDK, you get an automated trace for your app start so you can monitor how long it takes users to go through a cold app start.
The other feature Firebase Performance offers is monitoring network activity. HTTP/S requests made by your app will be automatically monitored from the time they are sent until the response is received. For each URL pattern, you will see the response time, payload size and success rate.
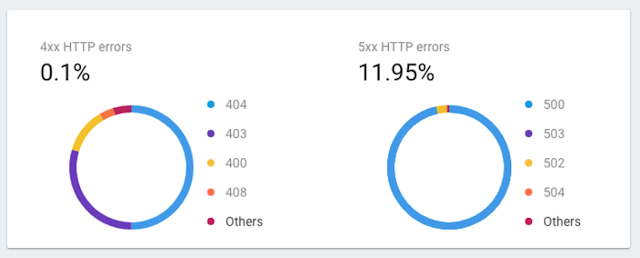
When failures happen, you will also see a breakdown of 400 and 500 response codes that caused them.
All metrics collected for traces and network can be broken down by country, device, app version and OS version. This helps you narrow down the cause of an issue and fix it more easily.
Firebase Performance Monitoring is available now in beta. To learn more, check out the documentation right here, or watch our I/O session for a deep dive.


