
Dashboards are great, but what if you’re not checking them? Wouldn’t it be great to know when you have a huge spike in traffic, or if you’re about to hit your concurrent connections limit for a single database? Don’t worry, Google Stackdriver Alerts have you covered!
Back in December, we announced that the Firebase Realtime Database has integrated with Google Stackdriver to let you create dashboards and graphs of powerful new metrics. We also have more in-depth descriptions of these metrics available in our documentation, as well as other monitoring and debugging tips for your databases. Now we’ve made all this data actionable through Google Stackdriver Alerts!
You can set alerts that will trigger actions whenever particular conditions are met. For example, if the metric io/database_load goes over 90% for more than one minute, an email will go out to your engineering team. It’s also possible to include documentation in your alert, which can help if you haven’t yet had your morning coffee. To learn more about conditions that can trigger alerts, see the Condition details documentation.
In addition to the plethora of available conditions, Google Stackdriver also lets you choose how to be alerted. On the basic tier, you can be notified via email or the Google Cloud Console Mobile App. On the premium tier, you’re able to create an incident via PagerDuty or have a message posted to your Slack Channel. One of my personal favorite premium notifications is the Webhook option, which you can even use to trigger a Cloud Function to help you diagnose the issue. For the load example, when your database is nearing 100% load, you could start a Cloud Function, have it profile your database, then report the findings to your Slack Channel.
Setting up a custom alert in Stackdriver is a straightforward process. Start by heading over to the Stackdriver Monitoring Console. Once you’ve signed up for an account, navigate to Alerting > Create a Policy. You should see a panel like this:
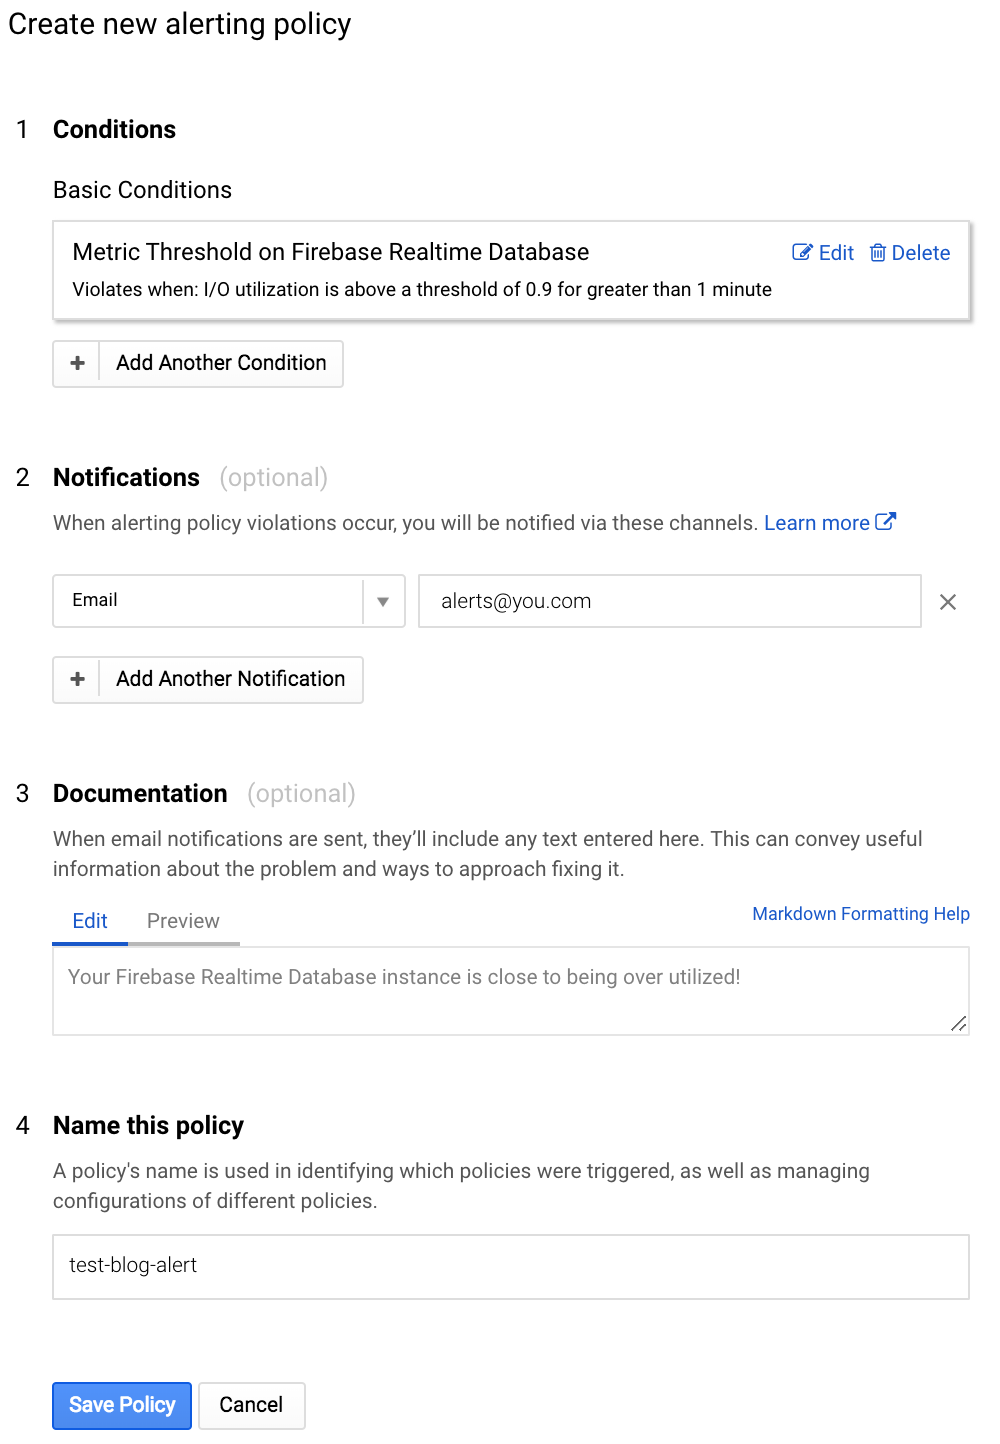
For this alerting policy, I’ve specified that when my database utilization is over 90% for more than a minute, I’ll receive an email at alerts@you.com with the name of the policy, plus the documentation I specified. Now all I need to do is hit the Save Policy button, and my alert is live!