
Firebase Performance Monitoring provides detailed insights into how your app performs in the hands of real users, giving visibility into bottlenecks that could be causing churn and revenue loss.
We’ve received positive feedback about the richness of performance data Firebase Performance Monitoring surfaces. However, a common complaint has been that it’s difficult to determine the cause of these issues from the data we surface, forcing developers to spend a lot of time investigating the root cause of performance issues.
For example, it’s great to know that your app launches slowly for 40% of your users, but why is this happening? Even though developers can use attributes such as app version, OS version, and geography to filter data in the dashboard, the data still may not give enough detail to pinpoint the exact issue at hand.
To address the need for actionable insights, we are pleased to launch the ability to dig deeper into an individual session of a trace, so you see attributes and events that happened leading up to a performance issue. With this feature, developers can see three new categories of information:
- Device properties, like app version, device type, OS version, and more
- Other traces and network requests happening simultaneously
- CPU and memory usage
Surfacing these extra details in the context of a trace will help improve debuggability and issue resolution for performance issues.
Let’s see how sessions works with a concrete example. Imagine you are an e-retail app developer using a custom trace, productImageLoading, to measure how long it takes to load an image of an item in your catalogue. You notice that an issue appears in the Firebase Performance Monitoring console for this trace because the product images are loading slower than the defined threshold of 200ms.
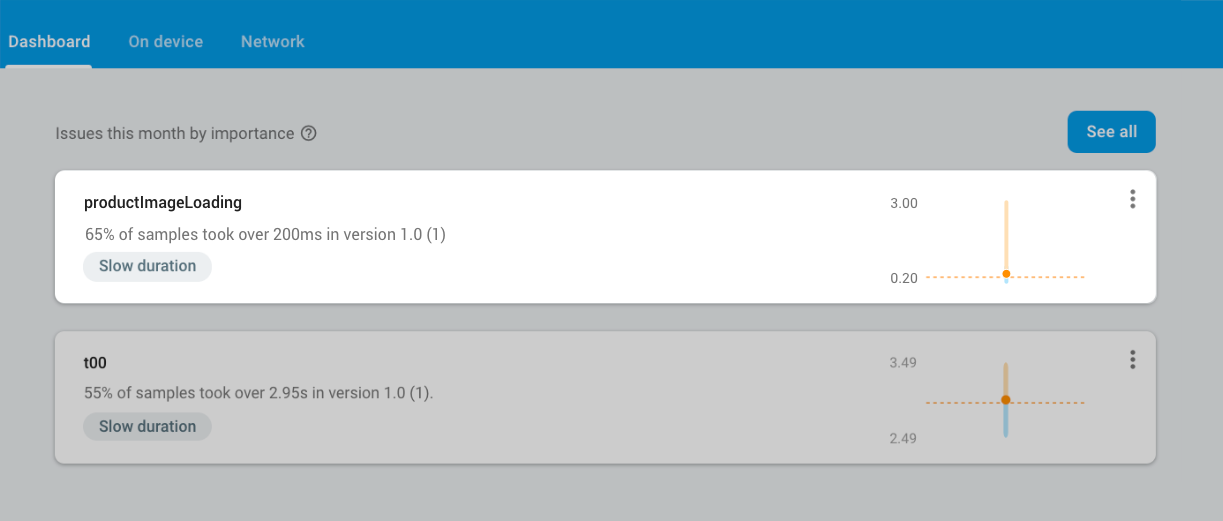
Performance Monitoring surfaces emerging issues.
Previously, if you clicked on the issue to get more details, you would see information like the median time for the trace, and you could slice the data by various segmentations, such as country, device, etc.
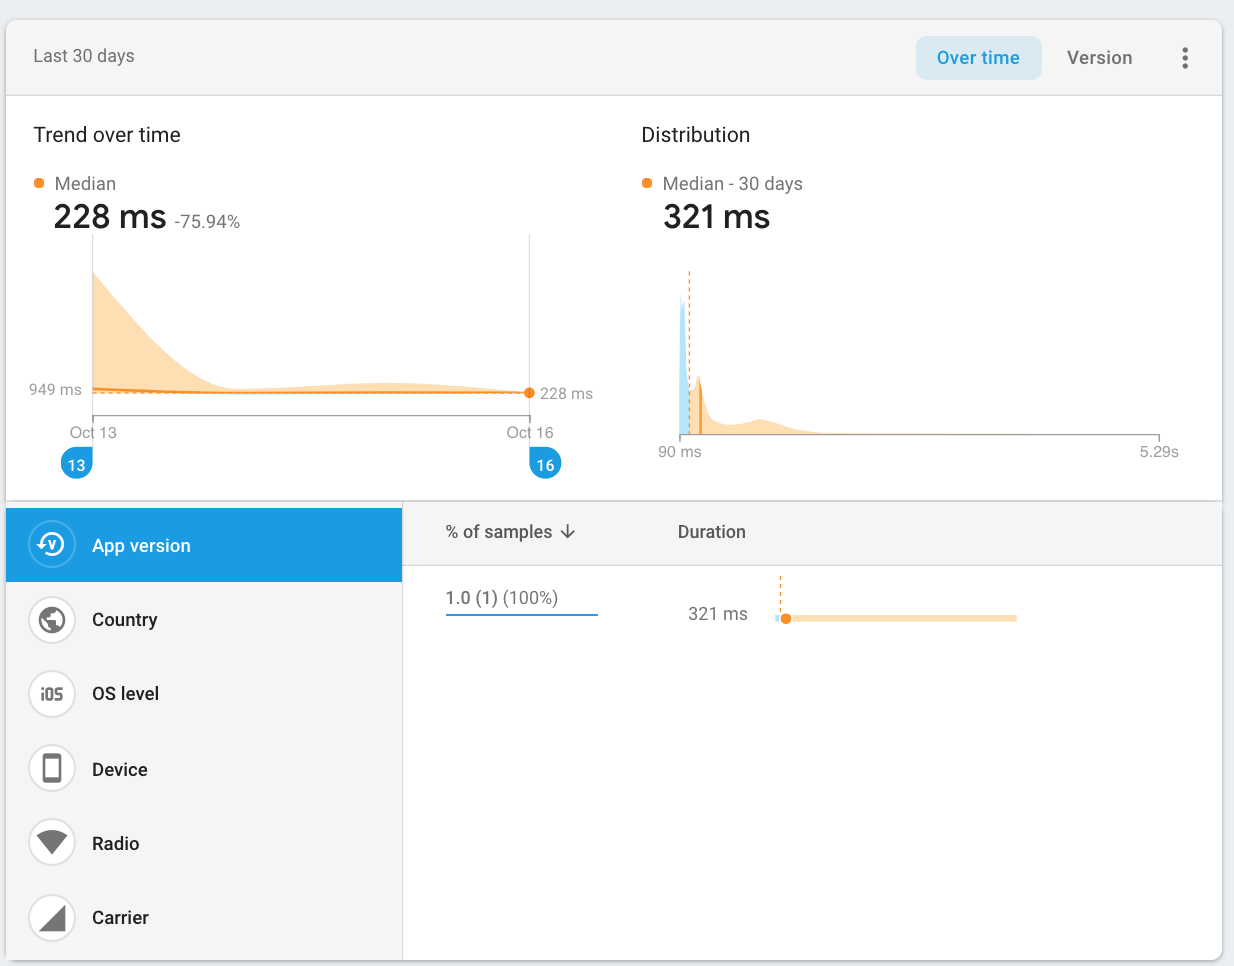
The issue details page shows more information and allows for data slicing
While the details page is helpful, it shows the information aggregated among all trace samples, which doesn’t give enough context about other factors that may have contributed to the issue.
This is where drilling down into a session of a trace becomes powerful. With this new feature, you can now examine device properties, system usage, traces and network requests that happened around the same time as the specific trace instance being investigated. You can access all sessions for the metric from the top bar of the metrics detail page. If you’re already segmenting your data by an attribute like app version or country, then you can click through to a pre-filtered view of sessions.
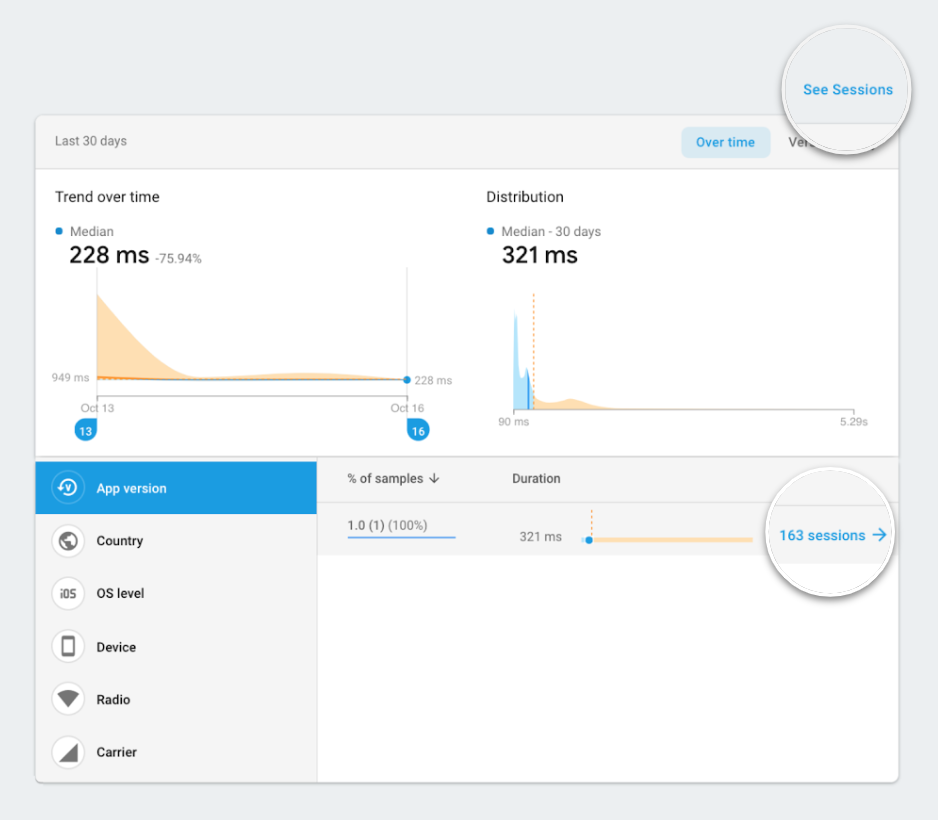
Sessions has 2 entry points
In the sessions view, you can narrow down sessions corresponding to a particular percentile range of the trace duration and look at the details of the trace instances for that range. The percentile range groups sessions into cohorts based on their performance making it easier to find the sessions with the worst performance:
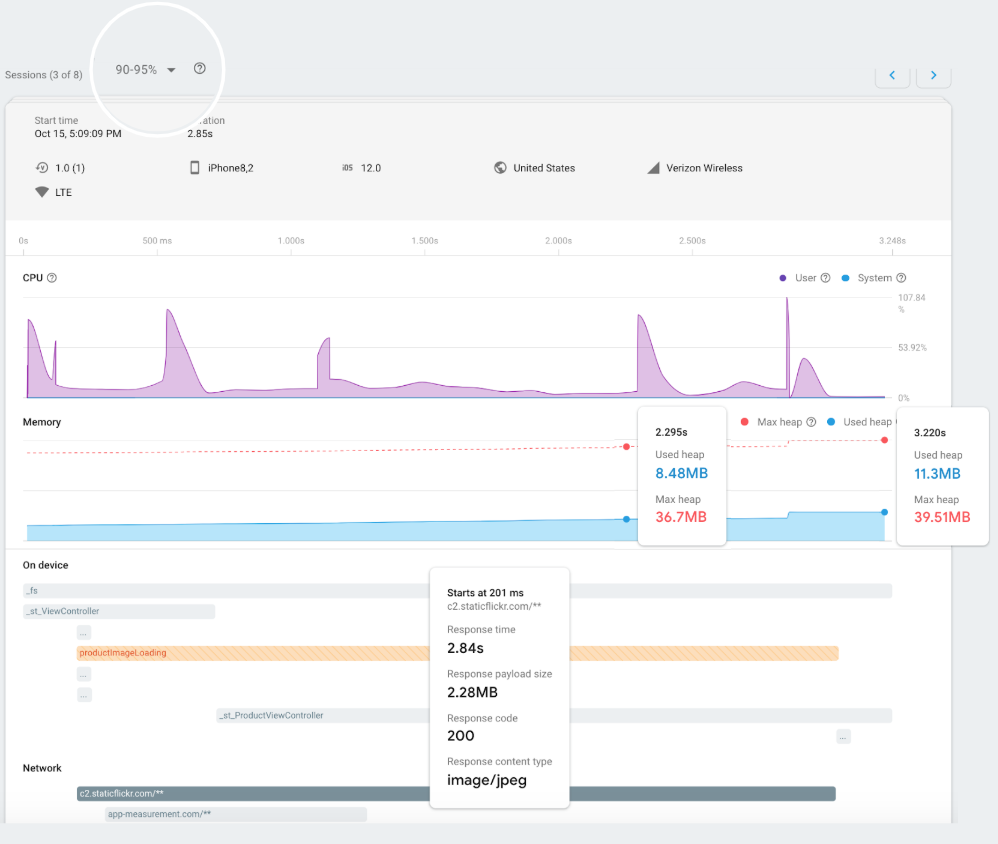
Sessions view showing CPU, memory, traces and network requests for a percentile range
Looking at a product image loading session in the 90-95 percentile range, you can see the following:
- The trace took 2.85s to complete.
- The “productImageLoading” trace runs for the same duration as a network request to fetch a 2MB size image.
- There is a spike in the CPU towards the end of the trace and network request.
- There is a slow growth in memory and then a spike towards the end of the trace and network request.
- The size of the memory spike towards the end corresponds to the size of the data fetched over the network by the network request (~2MB).
Based on the above trace session data, you can see that requesting a large image impacted memory and CPU, and subsequently slowed down loading of the product image. This helps you pinpoint where in your code to investigate the issue further.
This is just an example of the powerful debuggability that comes with the new feature. We hope that developers are able to use this new feature in a myriad of use cases to bridge the gap between cause and effect and greatly reduce time spent debugging trace issues.
To get started on iOS or Android, please see our docs here. If you have any feedback, feel free to share with us through our support channel. Happy building!