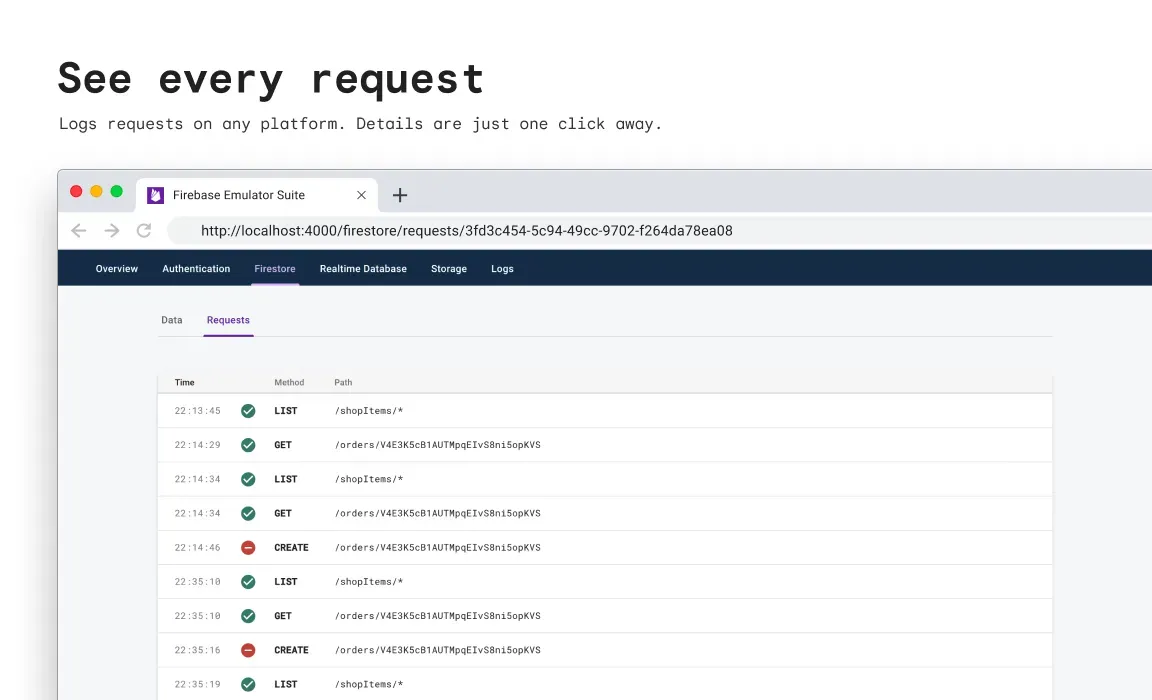
The Firestore Emulator Requests Monitor allows you to see requests to your local Firestore Emulator in real-time, and drill down to the details of each request, such as method, path, and Firebase Security Rules evaluation. You can access the Requests Monitor right now from the Emulator UI if you have the latest Firebase CLI running. (If not, it’s never too late to upgrade!)
Requests Monitor helps you understand your request traffic in detail, and puts Firebase Security Rules front and center (just like security should be in your production app). Ever wonder what collections are pulled in for the amazing pizza tracker feature in your app? Forgot about how that cute button is backed by 400 lines of code changes Firestore? Worried about changes to security rules breaking production apps? The Requests Monitor has answers to all of these questions, plus more!
A New Requests View
First, start the Emulator Suite, then navigate to the Firestore tab in the Emulator UI and you’ll be greeted with two views: the default “Data” view is the familiar data viewer and editor you know and love, and the “Requests” view is just a click away.

Each client request to the Firestore Emulator will be added to the table as a new row. For example, if you connect your app to the Firestore Emulator and create a new document, it will show as a CREATE request on the table in real time. This works regardless of which platform your app is on — be it Android, iOS, web, or anything else. And if you ever forget to open this page before you make those requests, don’t worry — we’ve got you covered. The last few requests will be kept for you to review when you navigate to the Requests page.
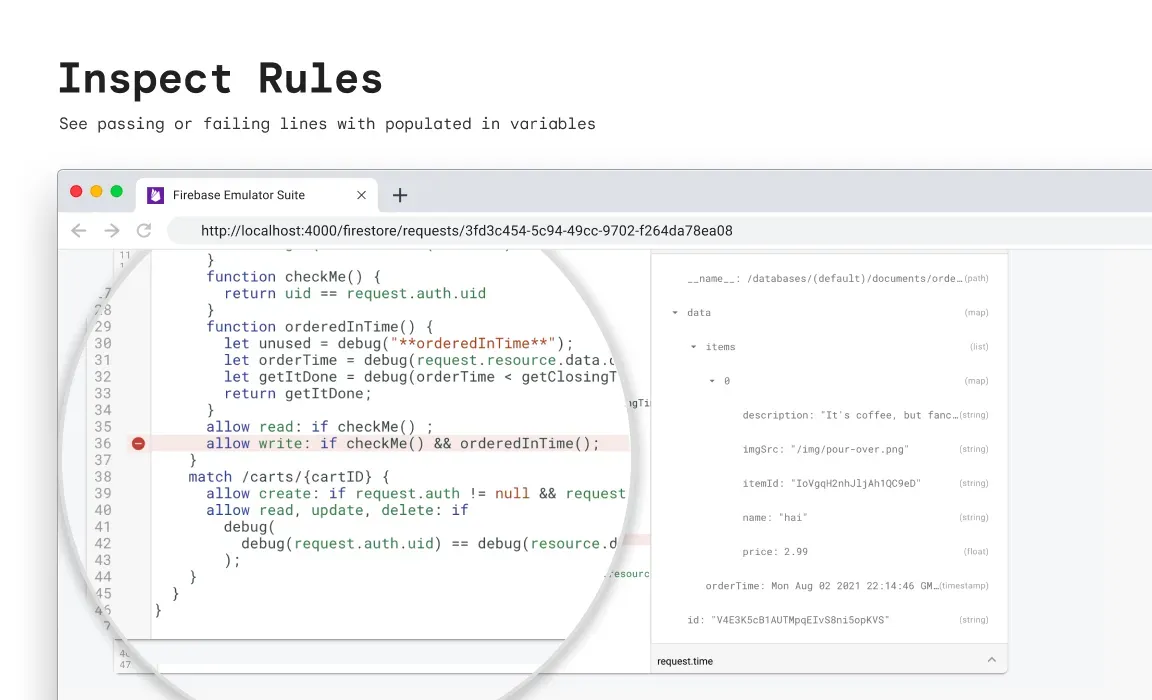
The Requests View is a great help in developing security rules. A checkmark indicates if the request has been allowed by your security rules; denials and errors are also displayed. If you follow best practices and keep your rules locked down as much as possible, you’ll certainly see some denials when you develop new features, and those are the perfect opportunity to learn! To take the guesswork out of updating security rules, just click on any request to see the evaluation details view.

On this page, you’ll see your current local security rules on the left, and some information about the specific request on the right. Statements that allow, deny, or error will be highlighted. You may also run into situations where the request is not yet covered by any of the allow statements and is thus denied by default. Ever wonder why a request is denied where it should be allowed, or the reverse? The panel on the right can help. You can see the existing resource, the would-be version of the document (i.e. request.resource) and other important fields in the request. If your goal is to modify the security rules to align with changes to your app, you can also use those fields as inspiration for new conditions that your rules should gate on.
While we’re at it, you’ll notice the security rules on the evaluation details page are not modifiable — that’s because they are snapshots at the time when the request happened. To make rules changes, just directly modify the firebase.rules file with your favorite editor or IDE and the Firebase CLI will automatically apply the changes to the Firestore Emulator. And if you make another request, it will show up in the table view as a different row with new rules and results. Sometimes, it may be helpful to compare the old and new rules and see differences in how they were evaluated.
For those of you who are familiar with the Security Rules Playground in Firebase Console, you may miss the simulated requests feature here. But in the emulator world, there’s no need to guess what a request should look like — you can just simply make that request from your app using the Firestore SDK in your favorite programming language. The Request Monitor always shows you faithfully how that request is represented in Security Rules and the actual decision of your rules. Any client request is fair game — even lists and queries that are hard to simulate in production. We think you will eventually get used to it and love this new interactive development workflow as much as we do.
Limitations
While you enjoy the new Requests Monitor, just keep in mind that only client requests are shown in the table. Admin requests bypass any security rules and therefore don’t appear in the list. Similarly, if your rules depend on other documents in the Firestore (e.g. get(...) or exists(...)), only the main request is shown but not the dependent fetches, even though those dependent fetches count towards your quotas and billing in production. Just remember emulated benchmarks are not an indicator of production in terms of performance or cost estimation.
We’ve already heard some developers asking if this feature will also be available in Firebase Console. While we cannot say for sure, recording production requests will certainly create a huge challenge to your app’s Firestore performance and security. Aaaand, well, you know, production is not the best place to test out changes, especially security-related changes. We recommend developing and testing locally before rolling out to production, and the Firebase Emulator Suite is always seeking ways to help.
Enjoy your new view into Firestore Emulator
With the Firestore Emulator and Requests Monitor, you can see your prototyping path more clearly. In fact, you have a better view into unit and integration testing as well: just make sure to keep the Monitor open and run your tests against the same (emulated) Project ID that your app connects to. You only need to deploy when you feel comfortable with your changes.
Feel free to play around with the Firestore Emulator Requests Monitor, and let us know what you think!
