
If you’ve visited the Firebase console’s Analytics section recently, you might have noticed something new… an updated Analytics dashboard, a new Realtime view and a few other UI enhancements.
These new changes are part of our effort to improve the Google Analytics experience in Firebase, by providing access to some of the newest Google Analytics 4 innovations directly in the Firebase console.
What’s new?
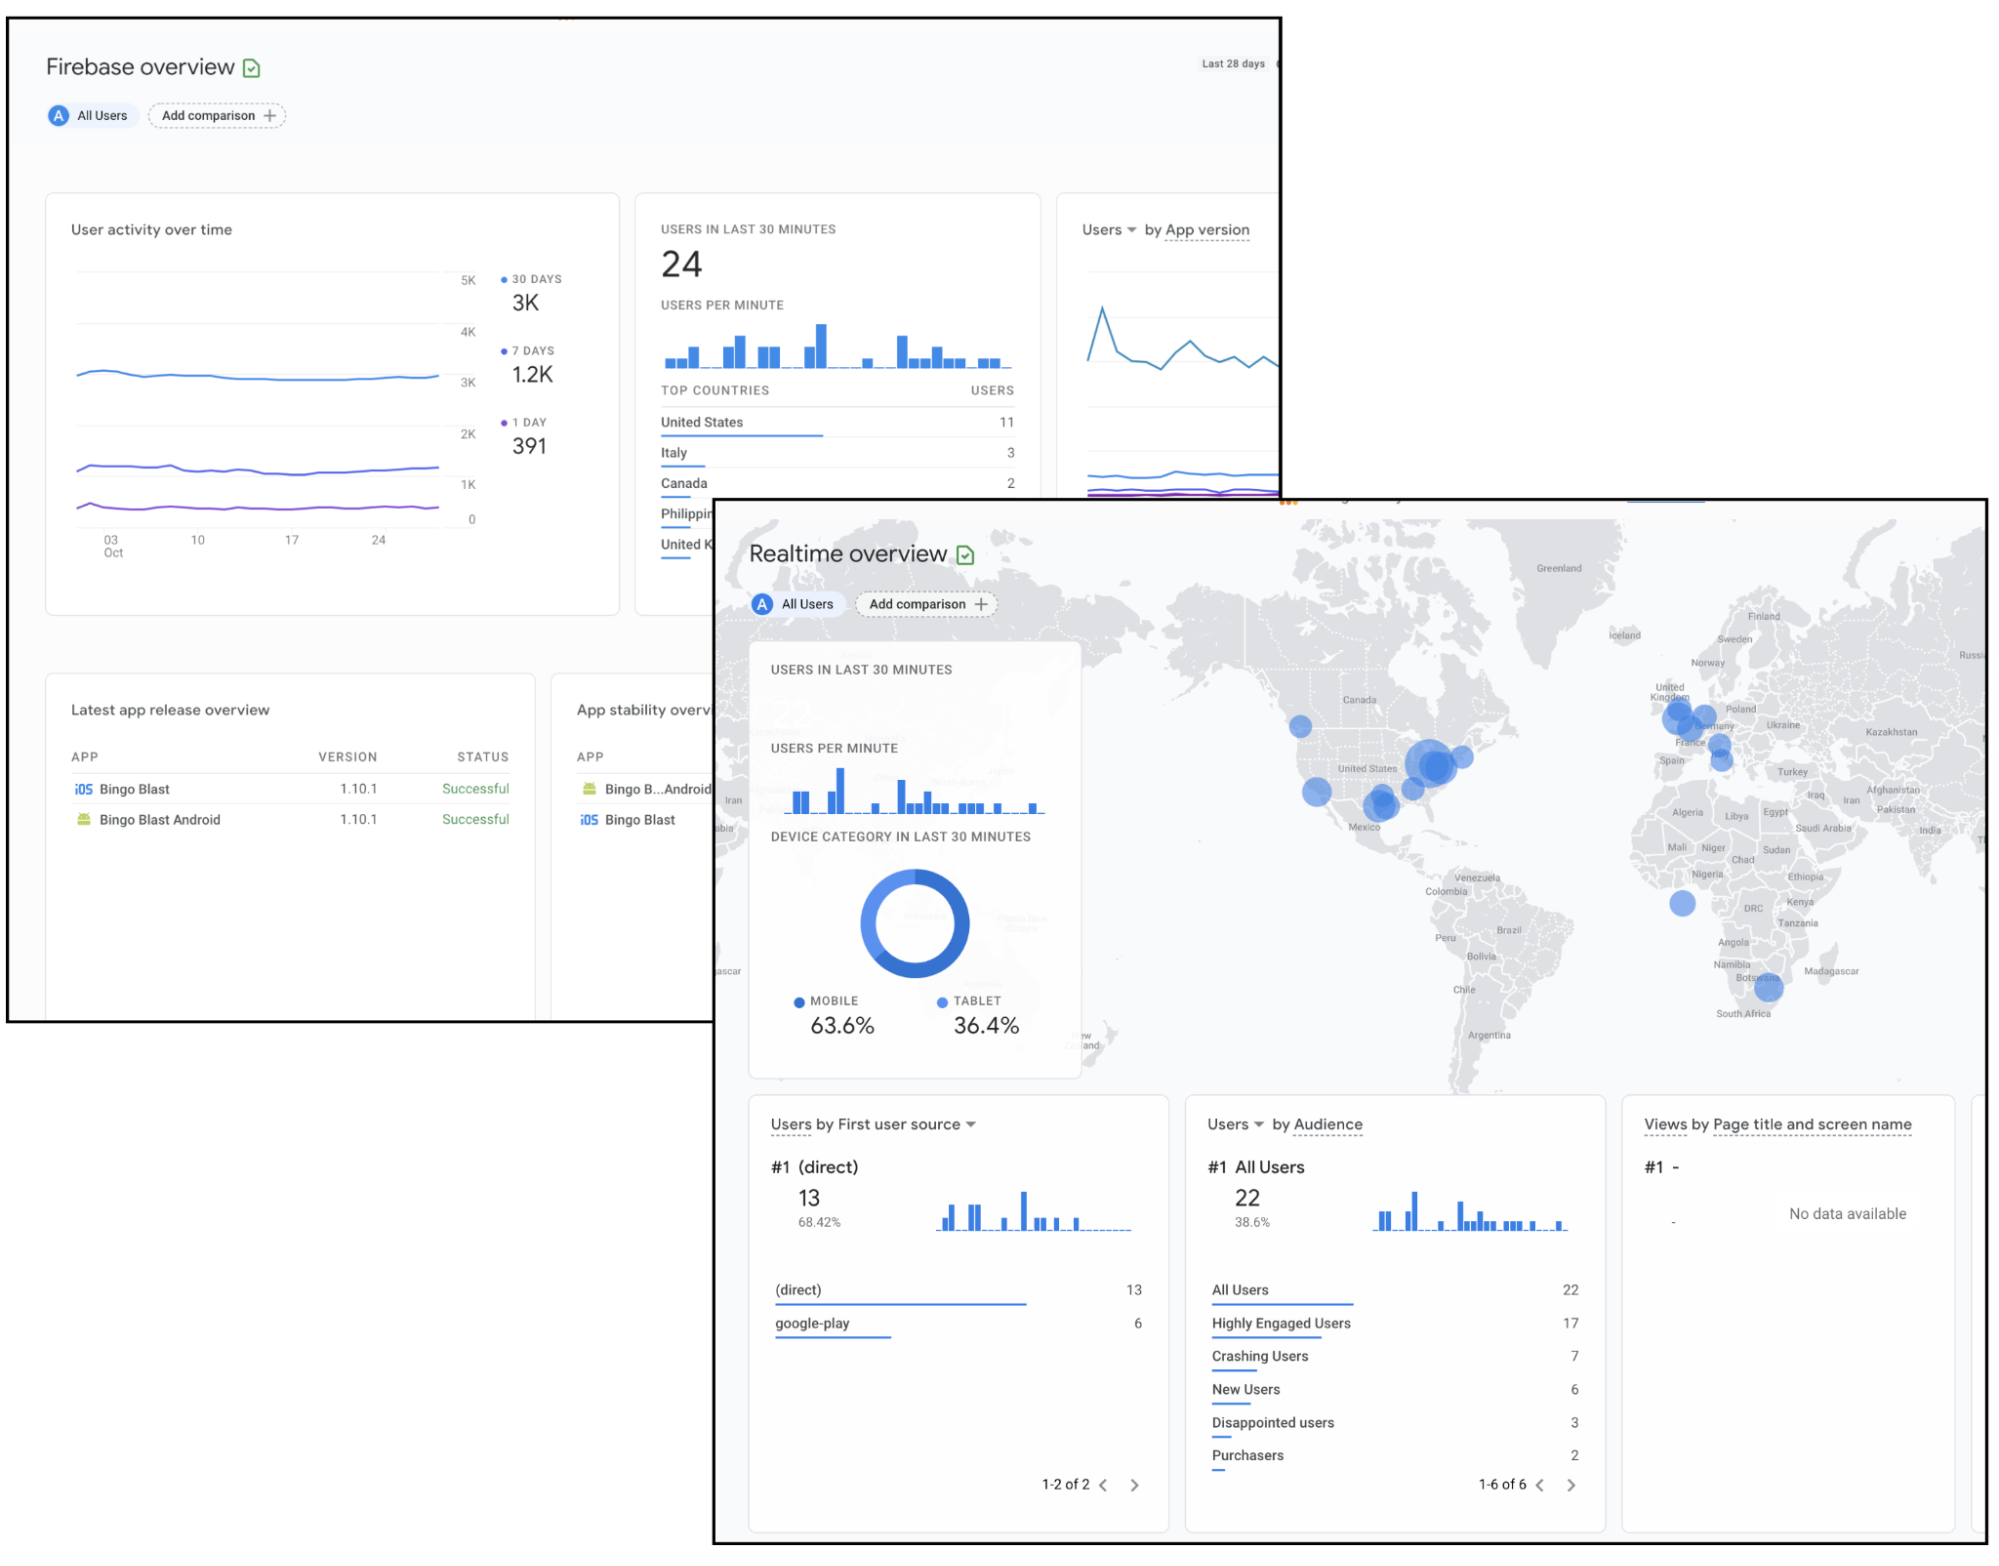
The Dashboard
Firebase now shows a curated collection of Analytics cards that provide the same information as the previous dashboard, but presented more intuitively to get to key insights faster. This matches the ‘App Developer - Firebase’ collection in Google Analytics 4 - meaning you no longer need to switch to the Google Analytics interface to see this data. The cards are now organized by surfacing overview metrics first, followed by user engagement and retention cards, then monetization and user demographics.
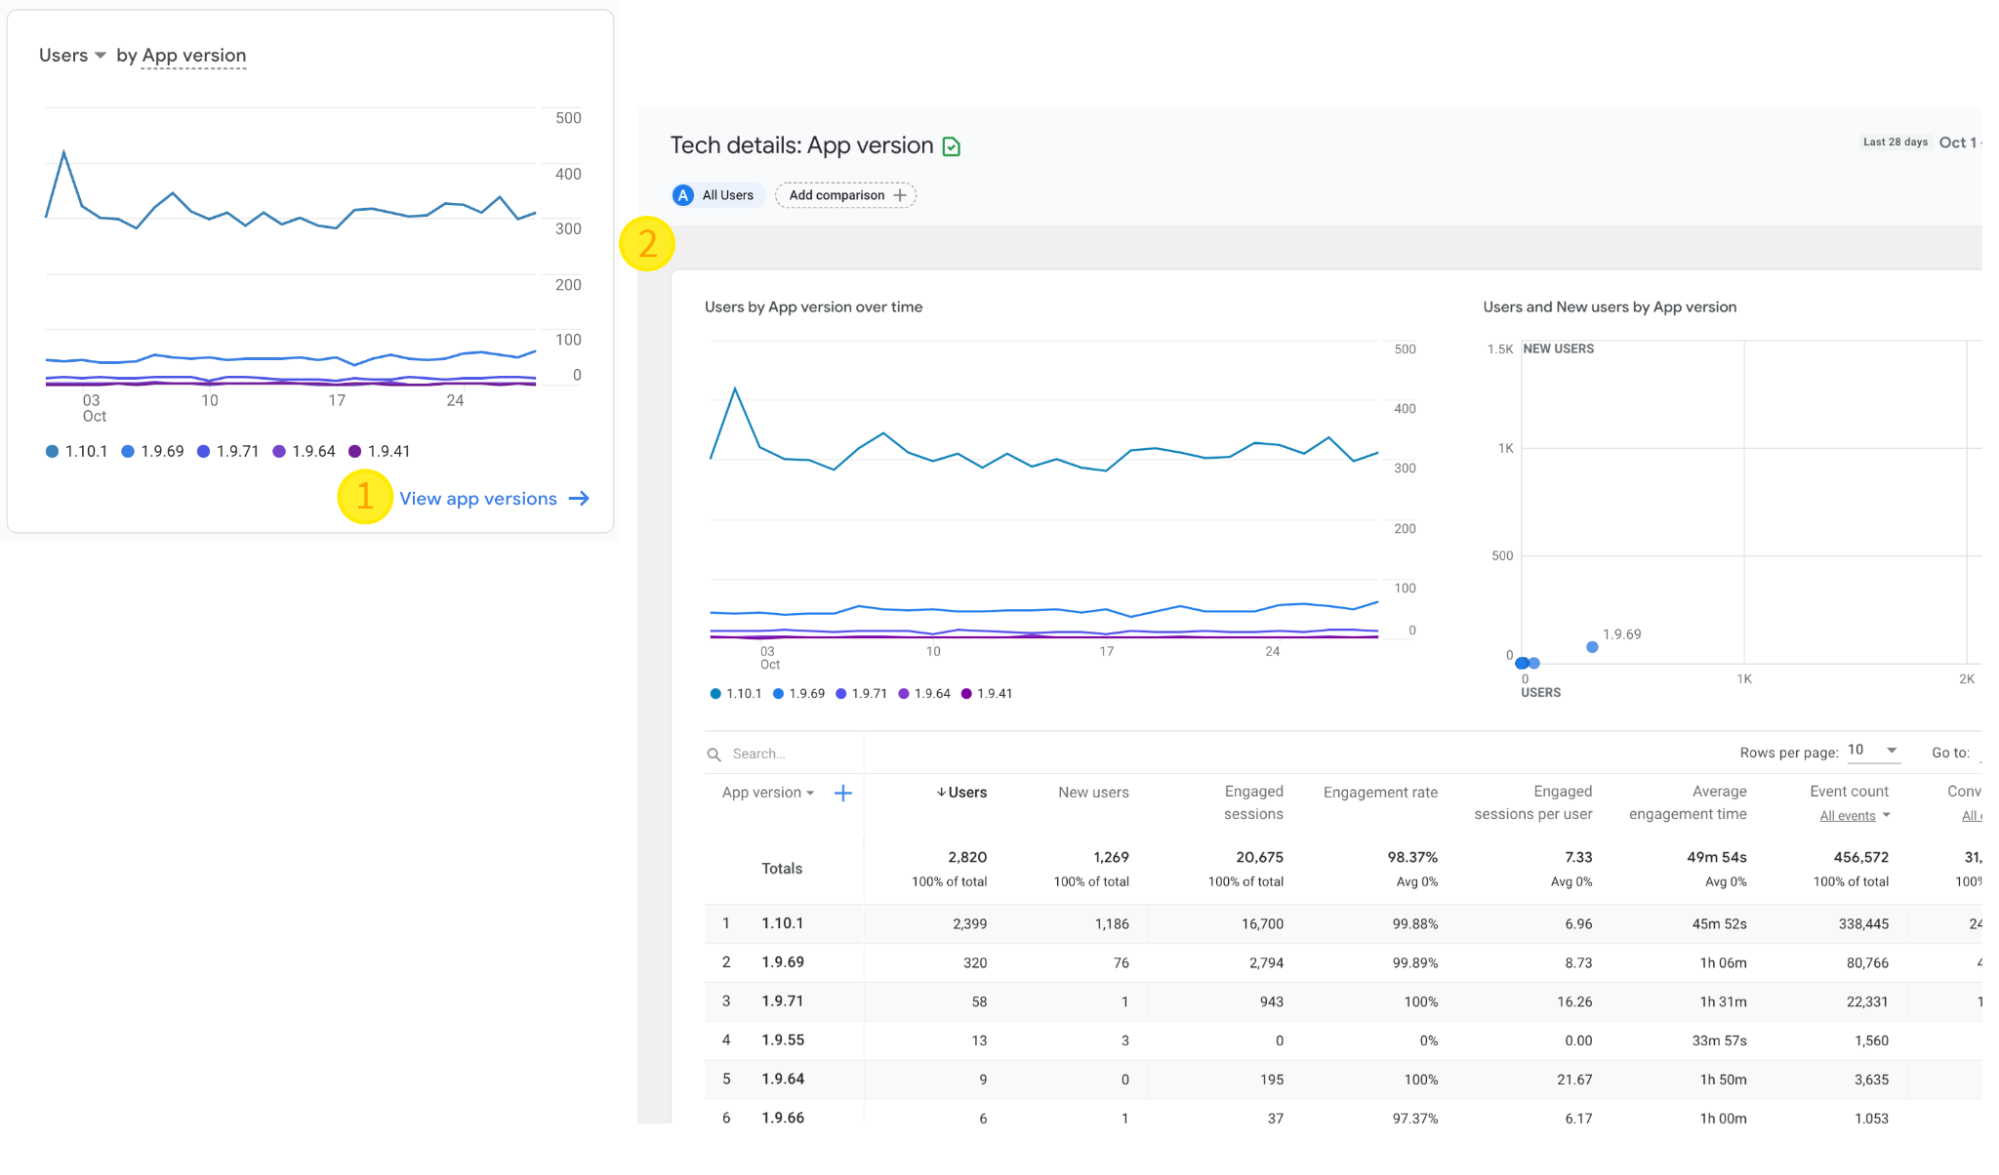
The dashboard now also contains a lot of explorer cards that allow you to more easily drill-down into specifics for data represented by that card for more details - like the new App Versions card which provides a quick view into the number of users you have per app version, and a jumpoff link to see more data like engagement rates, revenue and conversions per app version as well.
The Publisher card is another example of providing a more natural flow to learn more about how different ad units are performing as well as the revenue they are generating.
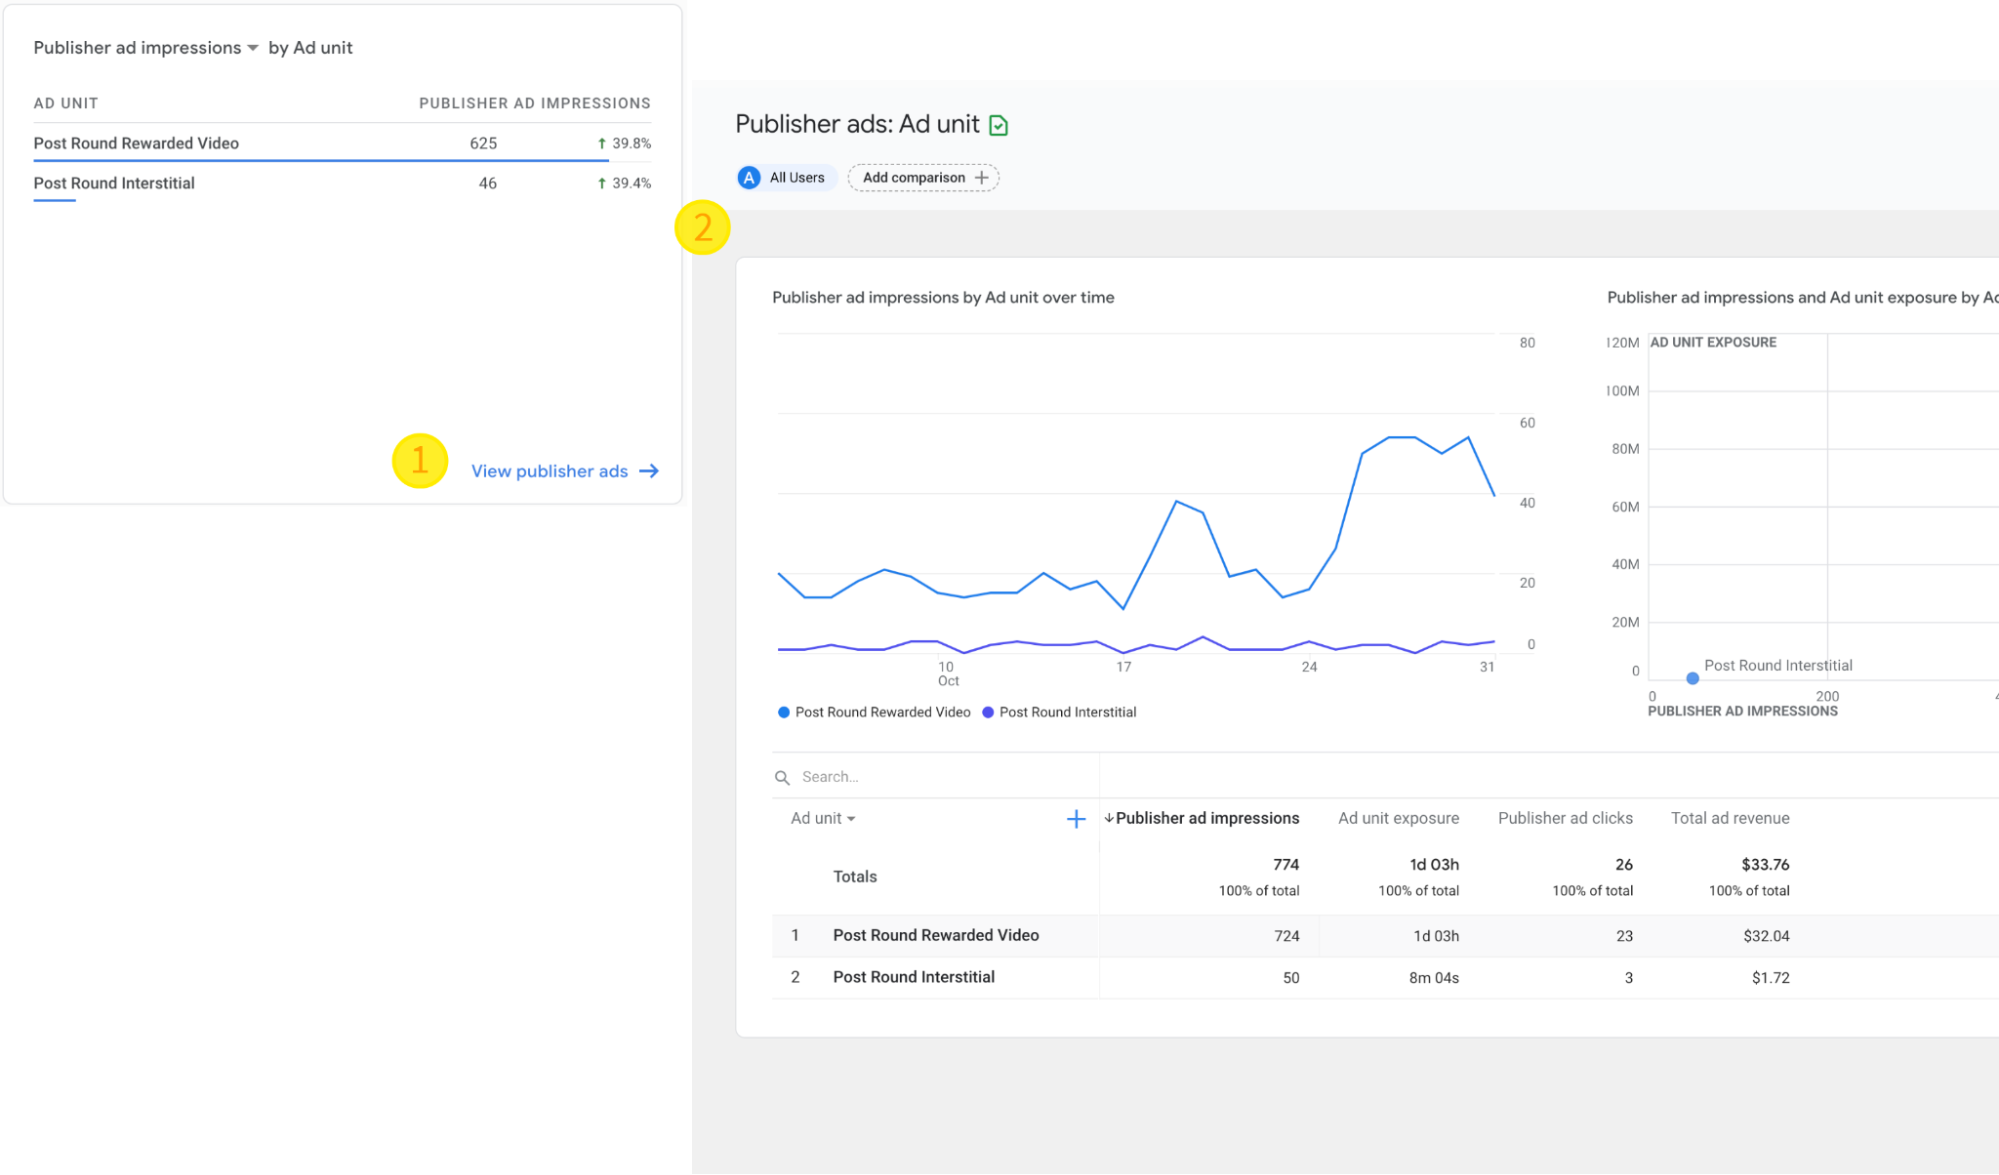
Before adding this card to the dashboard, accessing this information would require digging into specific event reports, like the ad_impression event report to get out the ad unit performance or revenue data. Well, no need to go digging through various event reports anymore with this updated flow that should make accessing this information more convenient and intuitive.
Check out this Google Analytics help center article for more information about the differences between the new and older dashboard cards in the “Data cards before and after” section.
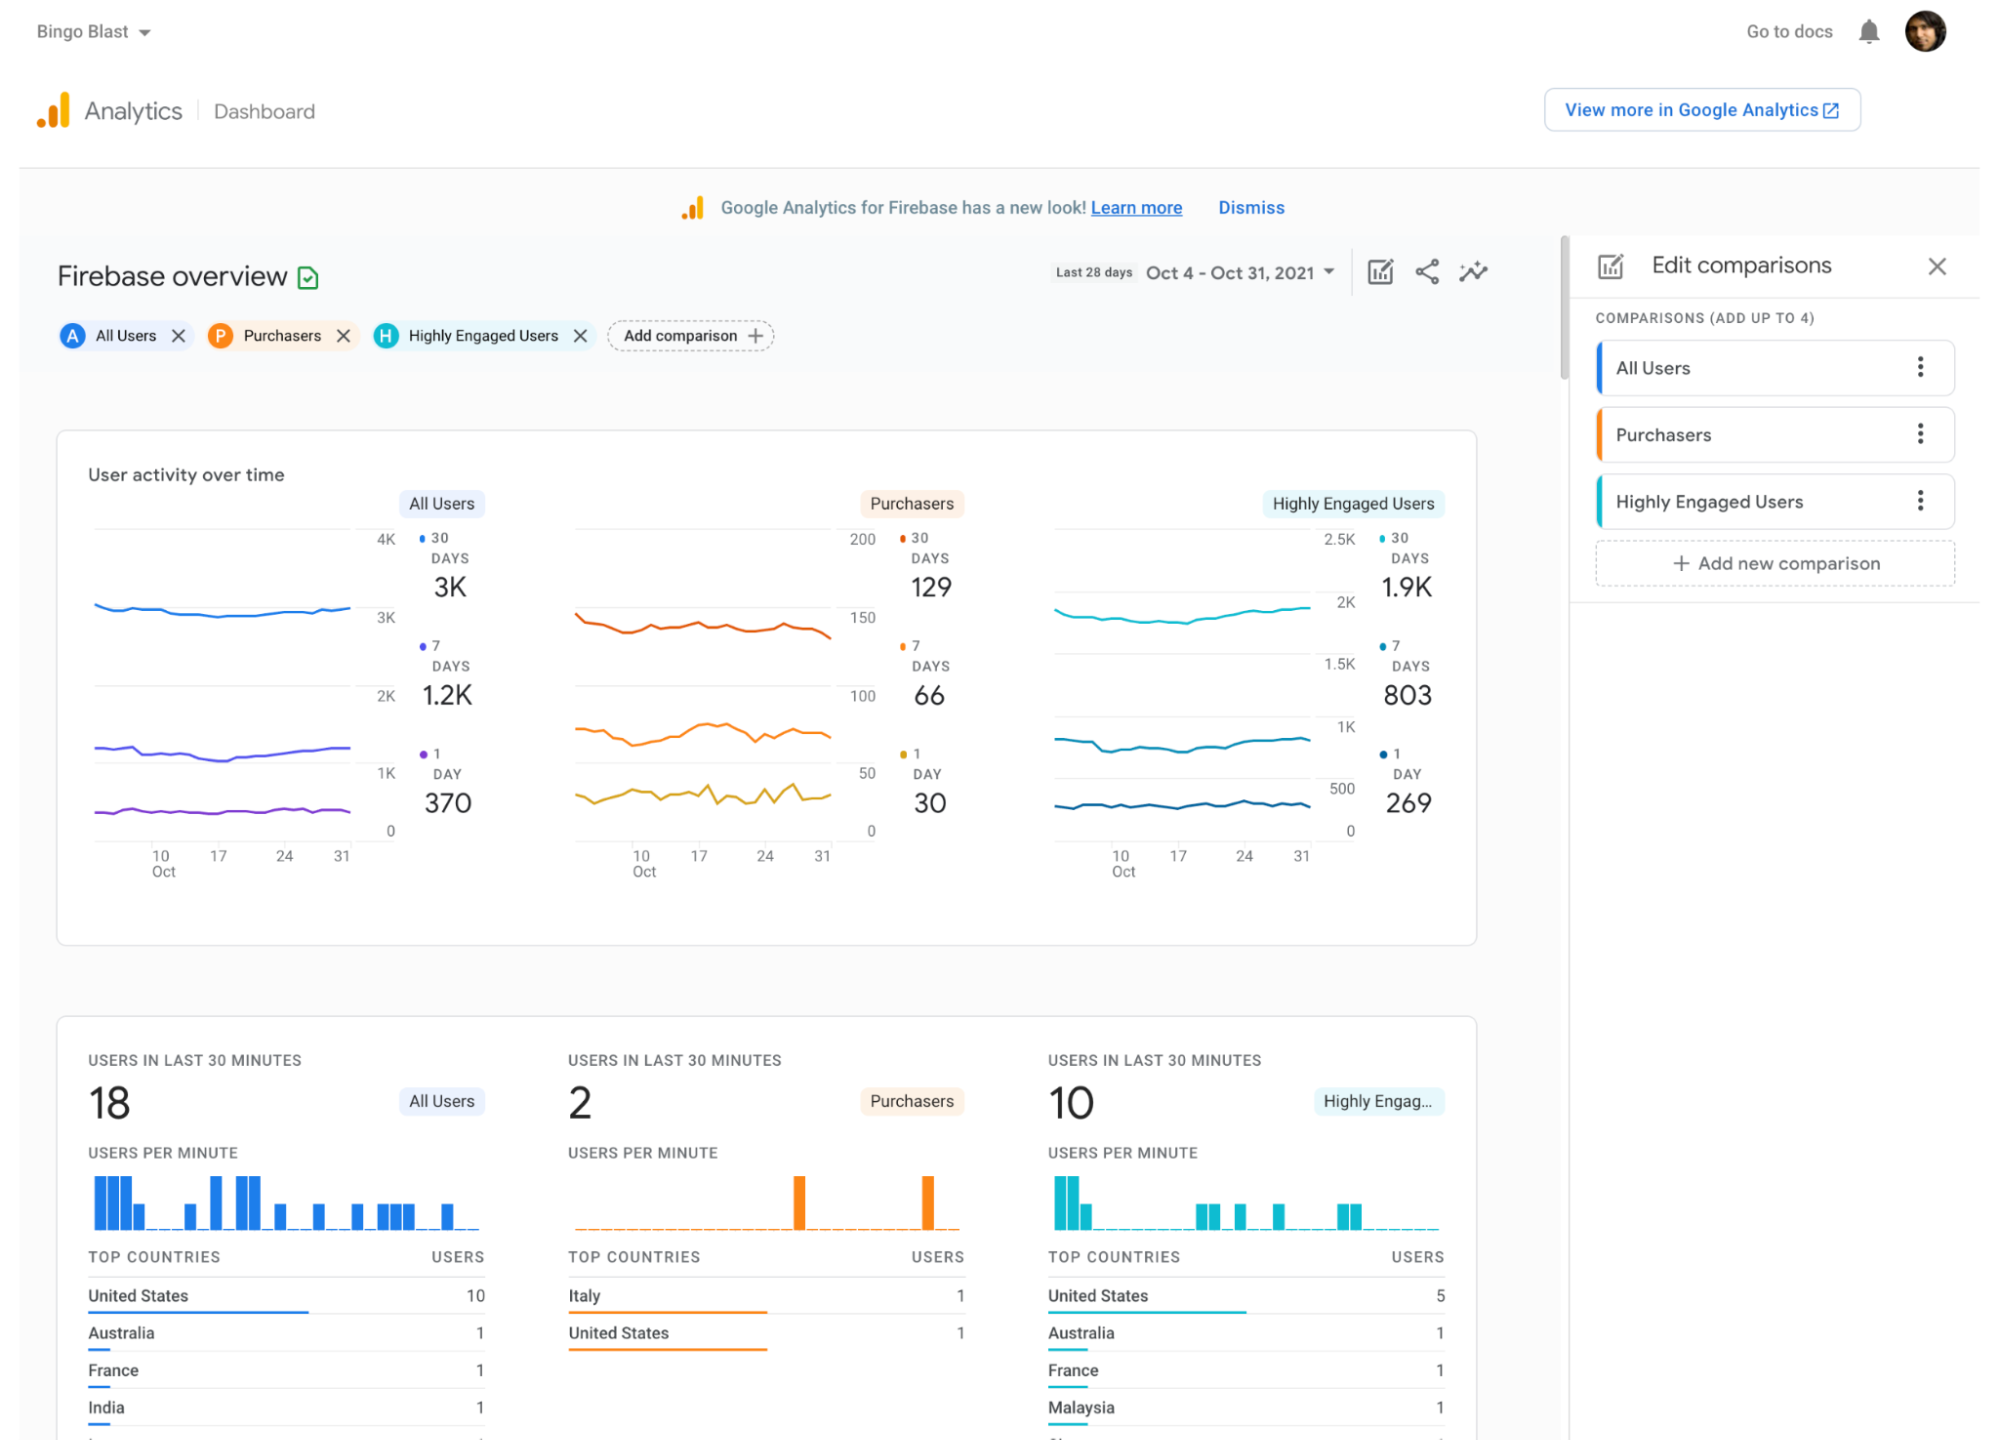
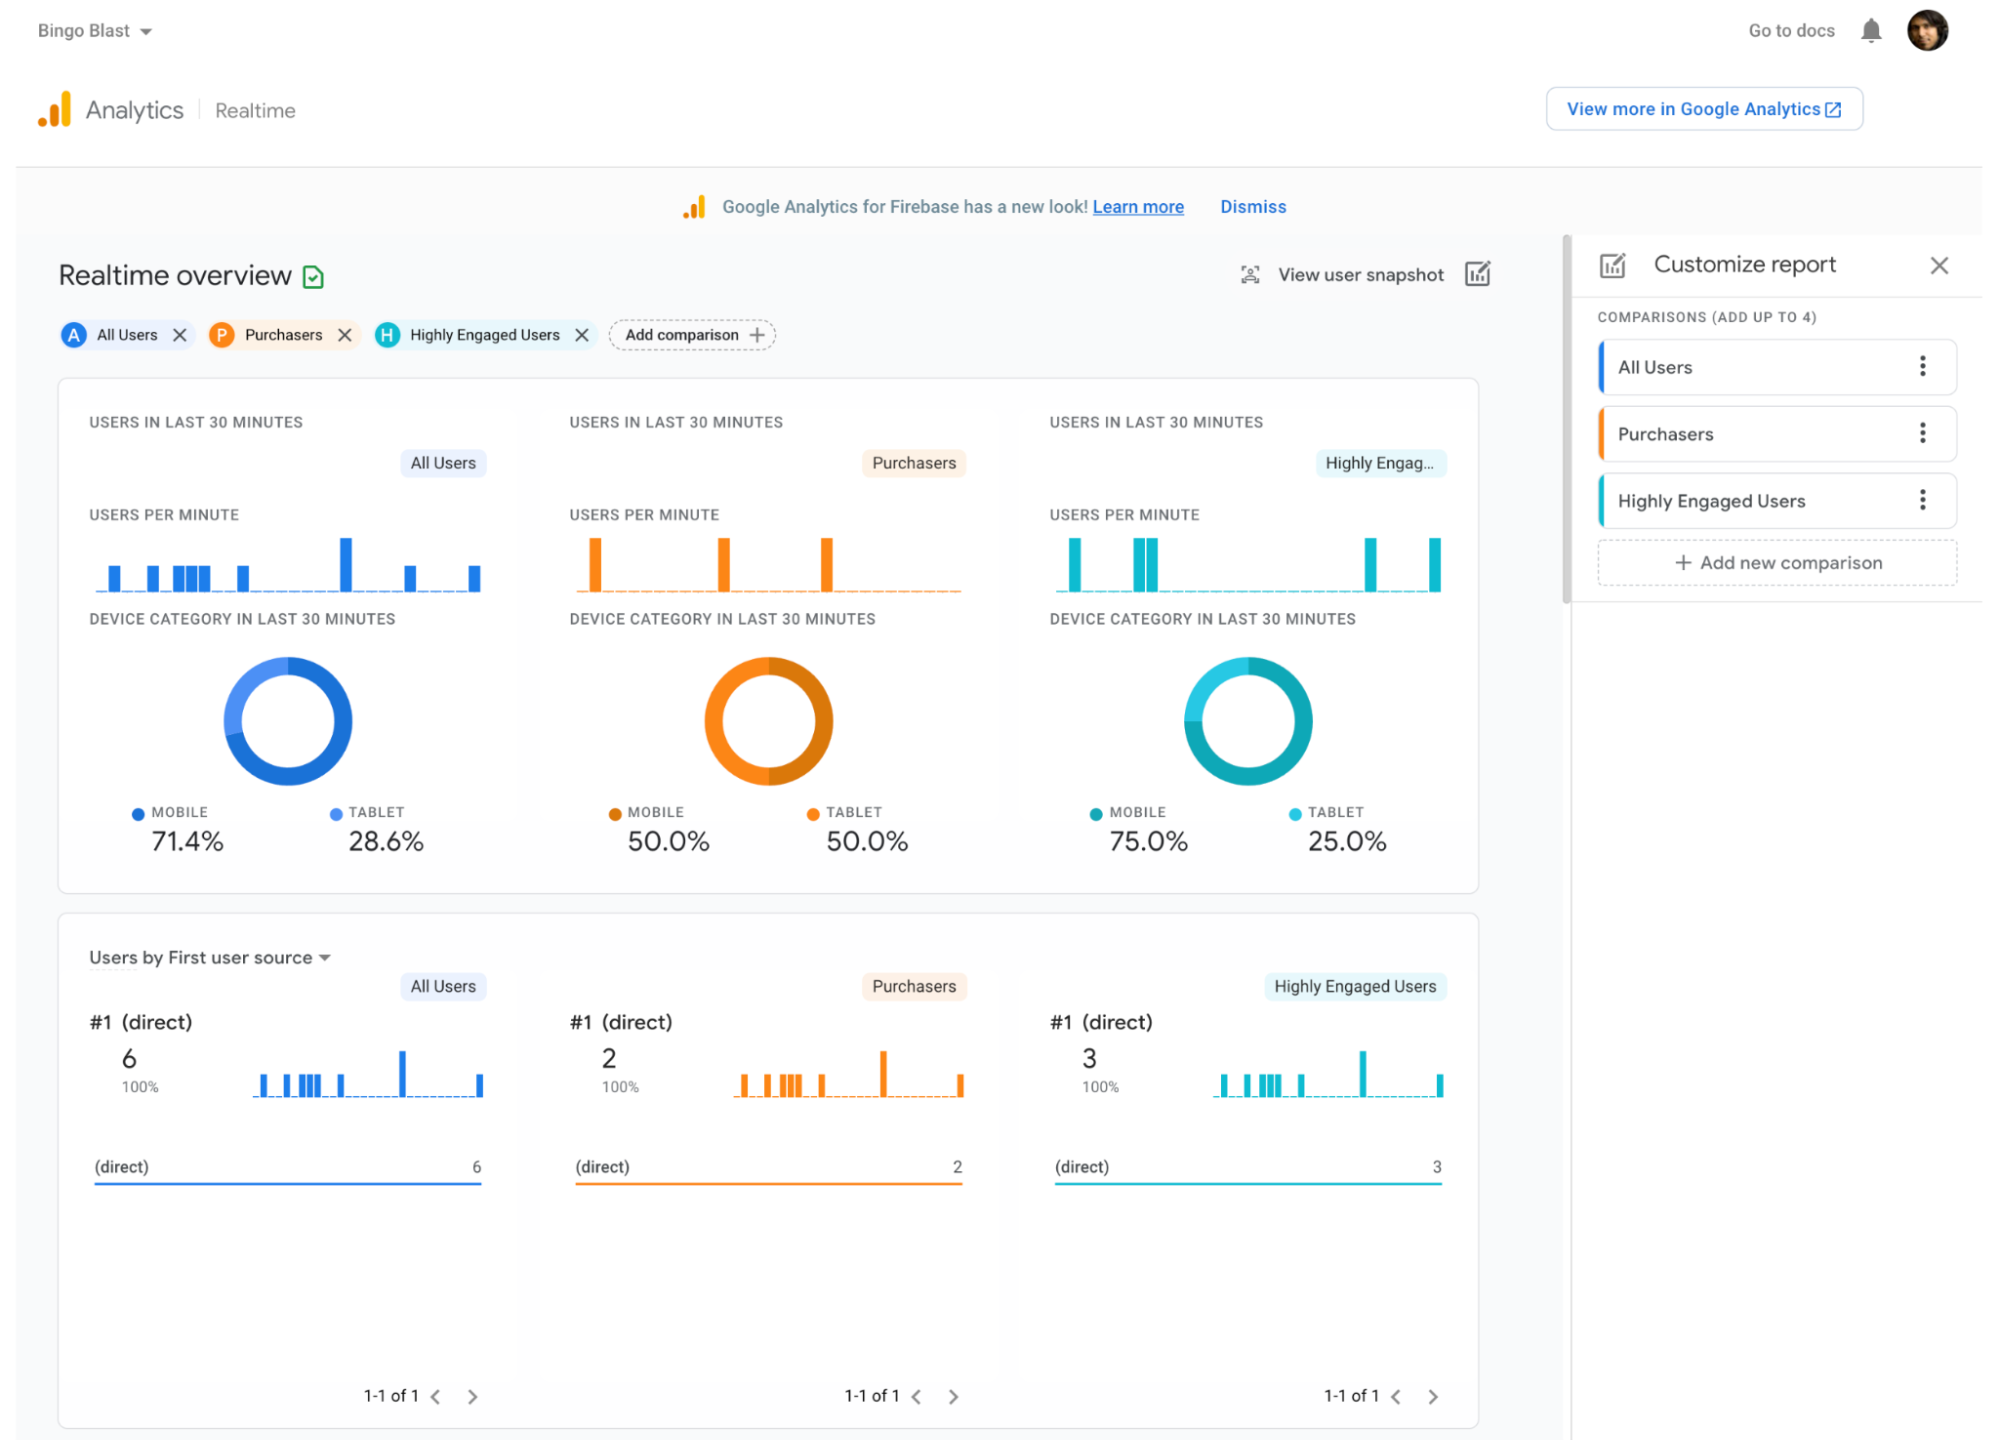
Comparisons
One feature that’s been around in Google Analytics 4 for a while but only just making an appearance in the Firebase console is the Comparisons tool, which replaces what was previously ‘Filters’. Similar to the Filters tool, with the Comparisons tool you can create comparison groups based on any custom or pre-defined Analytics dimensions or audiences. The advantage of the Comparisons tool is that you can create up to five comparison groups at once, and view and compare the Analytics data for each of these groups across all cards on the Analytics dashboard. For example, if you recently ran a promotional campaign offering 10% off in-app purchases to your top purchasers using Remote Config, you can check to see the impact of that at a glance on metrics like user engagement and app revenue by comparing the top purchasers audience, your most engaged users audience, and all users by applying Comparisons in the dashboard.
Note to compare events or conversions as you would have done using Filters in the past, you can navigate to the Events or Conversions card from the dashboard to reveal a detailed report that you can then apply comparisons on.
Check out this article or this video that covers how to use the Comparison tool in more detail.
The Realtime view
The Realtime dashboard now shows the same views as in Google Analytics 4 and is great for, well, seeing events come in real-time from around the world. This can be really useful after just releasing a new feature, and seeing new events come in for the first time as it rolls out to your users. The updated dashboard contains new cards and new card capabilities, like the User Acquisition card that can be filtered by source, campaign, medium and platform, as well as the Users card that can now be filtered by audience.
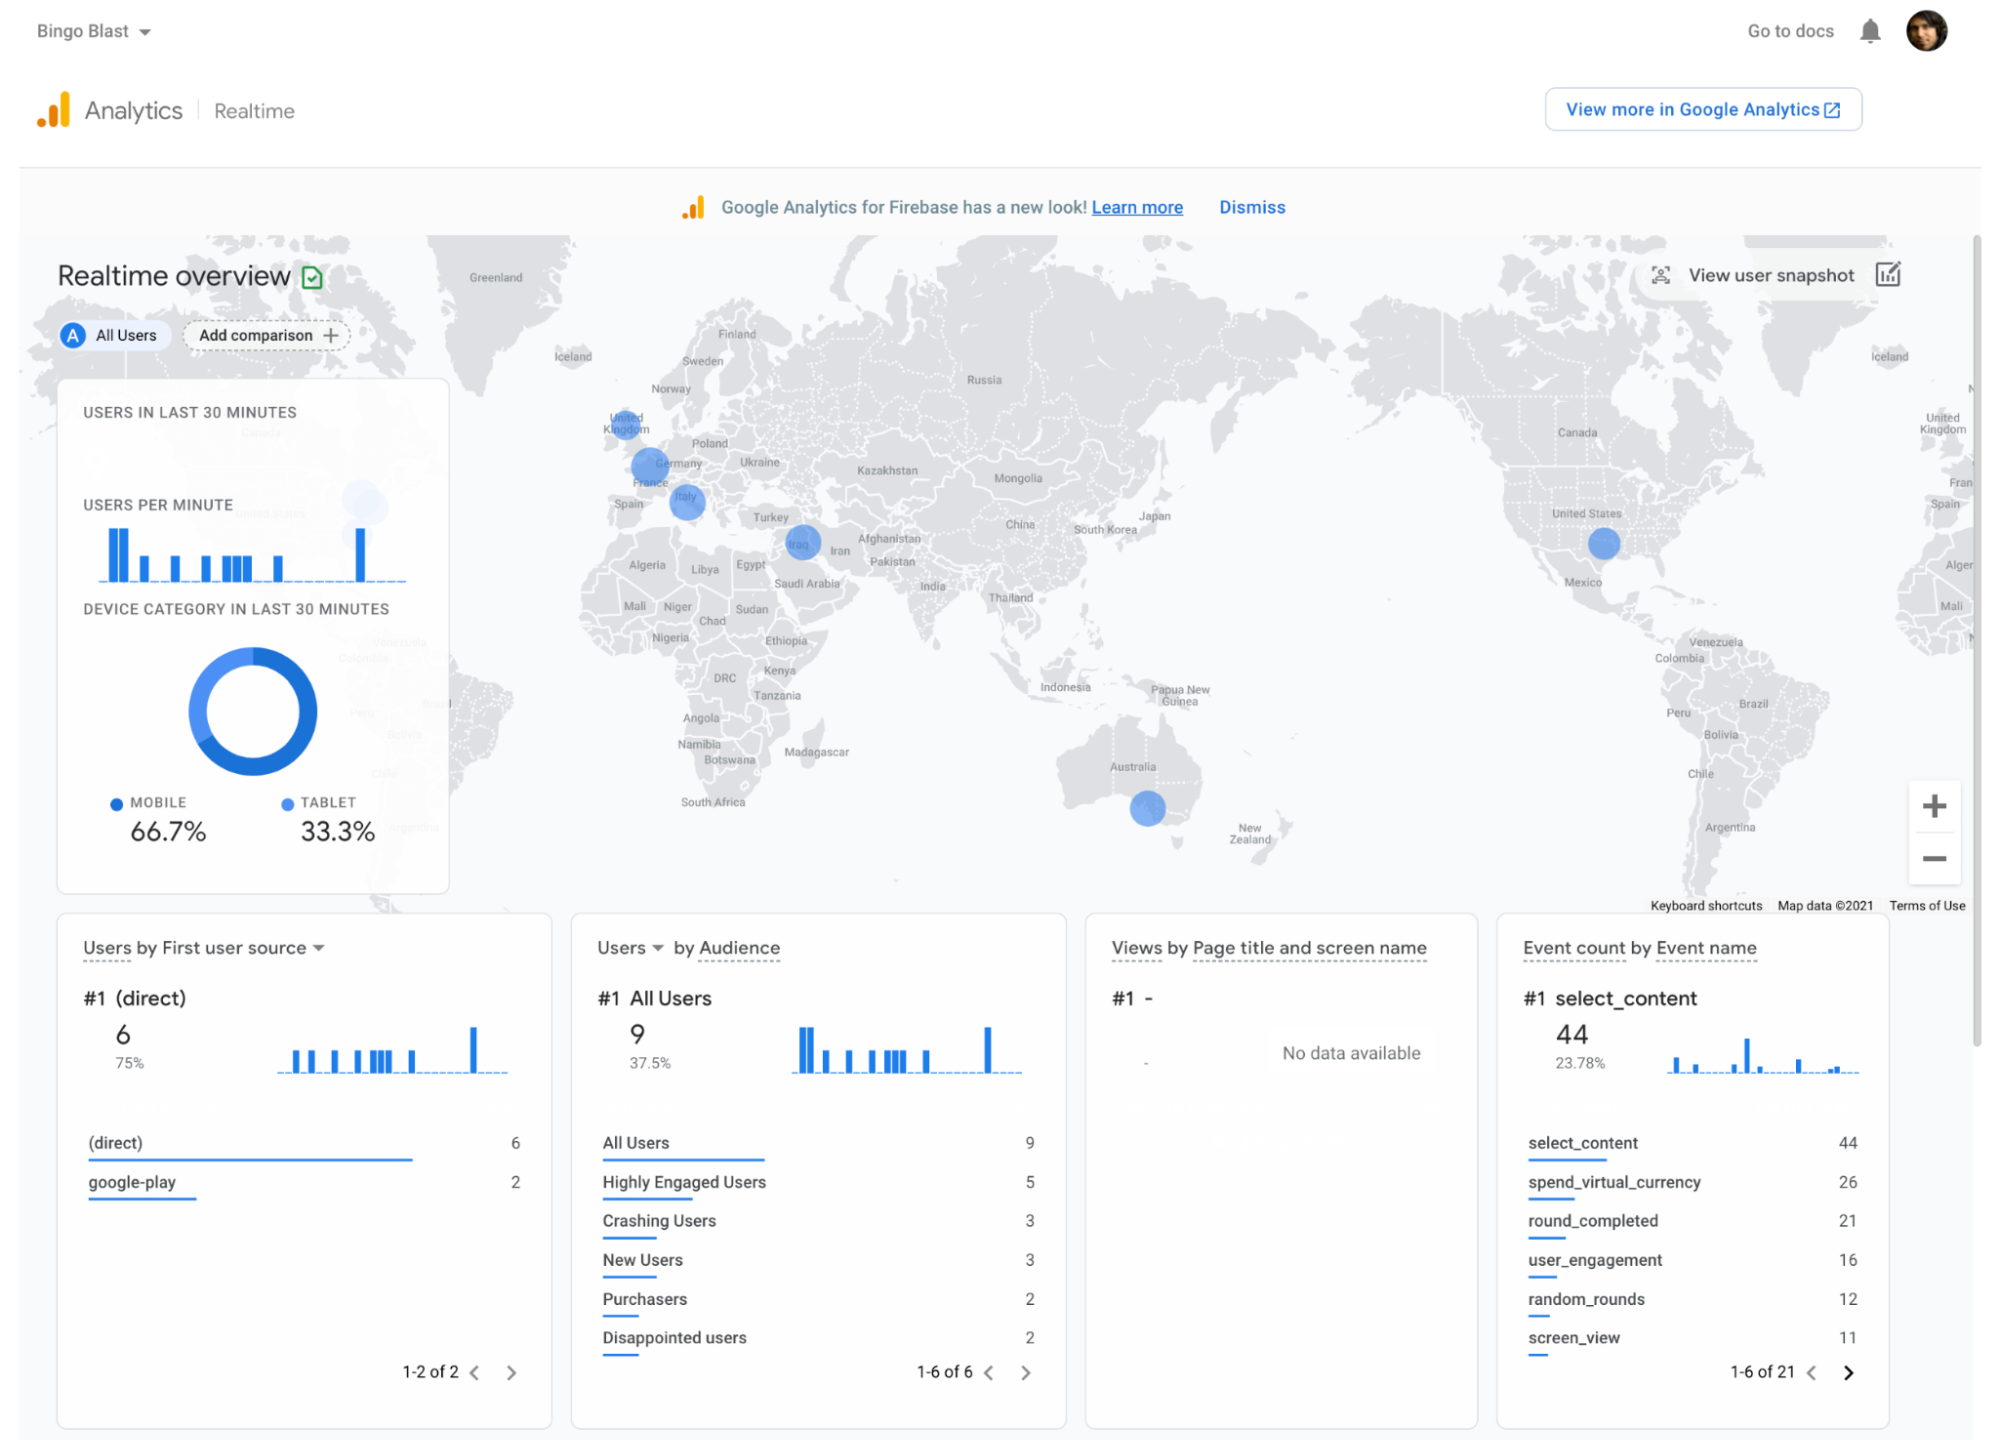
One of the biggest benefits of this new change is the ability to use the Comparisons tool in the Realtime dashboard, too, so you can create and compare different groups over real-time app analytics data.
Google Analytics settings page
As part of this change, the Google Analytics settings page now links out to the Google Analytics console where you can modify any Analytics settings as you would previously in the Firebase > Project Settings > Integration > Google Analytics page. The Analytics Linking card however is still available and can be edited from within the Firebase console.
Got any questions?
We invite you to take the updated Analytics dashboard in the Firebase console for a spin, and as always, let us know if you have any feedback or questions.