
This is the sixth article in a series that dive into creating a new Android application from scratch using Jetpack Compose for the user interface and other tools offered by Google, like Firebase Authentication, Crashlytics, Cloud Firestore, Performance Monitoring, Remote Config, Firebase Extensions, Firebase Cloud Messaging and Hilt.
Part 1 of this series provides an overview of what you can do with this app and how it is structured. Part 2 describes how to implement login and sign up flows using Firebase Authentication. Part 3 covers how to add Firebase Crashlytics to handle crashes and display messages to the user. Part 4 covers how to store data in the cloud using Cloud Firestore. Part 5 shows how to add Kotlin Coroutines and Kotlin Flow.
In this sixth article of the series, we provide an overview of Firebase Performance Monitoring and describe how to monitor the quality of your application by adding it to the codebase. We also cover what is automatically measured by this product, and how you can add custom traces to monitor specific parts of the code.
Firebase Performance Monitoring
Gain insight into your app’s performance issues
Monitoring the performance of your app is critical to its success. If your app’s performance is poor or your users spend too much time trying to complete a task, your users are likely to stop using the app. Firebase Performance Monitoring helps you run your app with confidence by giving you real-time insights into the performance characteristics of your Android, Apple, Android, and web apps.
As soon as you add the Performance Monitoring SDK to your Android app, it automatically starts collecting performance data from your app, including: data related to your app’s lifecycle (like app start time), data for screen rendering in your app, and data for HTTP/S network requests issued by your app. You don’t need to enable anything else in the Firebase console or even add a piece of code. You can then review and analyze that data in the Firebase console to understand where the performance of your app can be improved.
Traces, Metrics and Attributes
The information collected in your app is displayed in the Firebase console in the form of traces. A trace is a report that contains data captured between two points in time in your app. Inside each trace, you can find different metrics. A metric is a numeric value that can be charted and measured over time, and they can vary depending on the type of trace. Traces can also contain attributes, which represent the information collected each time an instance of your app runs a monitored process. Typically, an attribute is a string value that helps you filter and segment data in the Firebase console.
Understanding the dashboard
Speaking of the Firebase console, Fig. 1 shows what the Performance dashboard looks like when you open it. You can find the Performance dashboard under the Release & Monitor menu in the Firebase console.
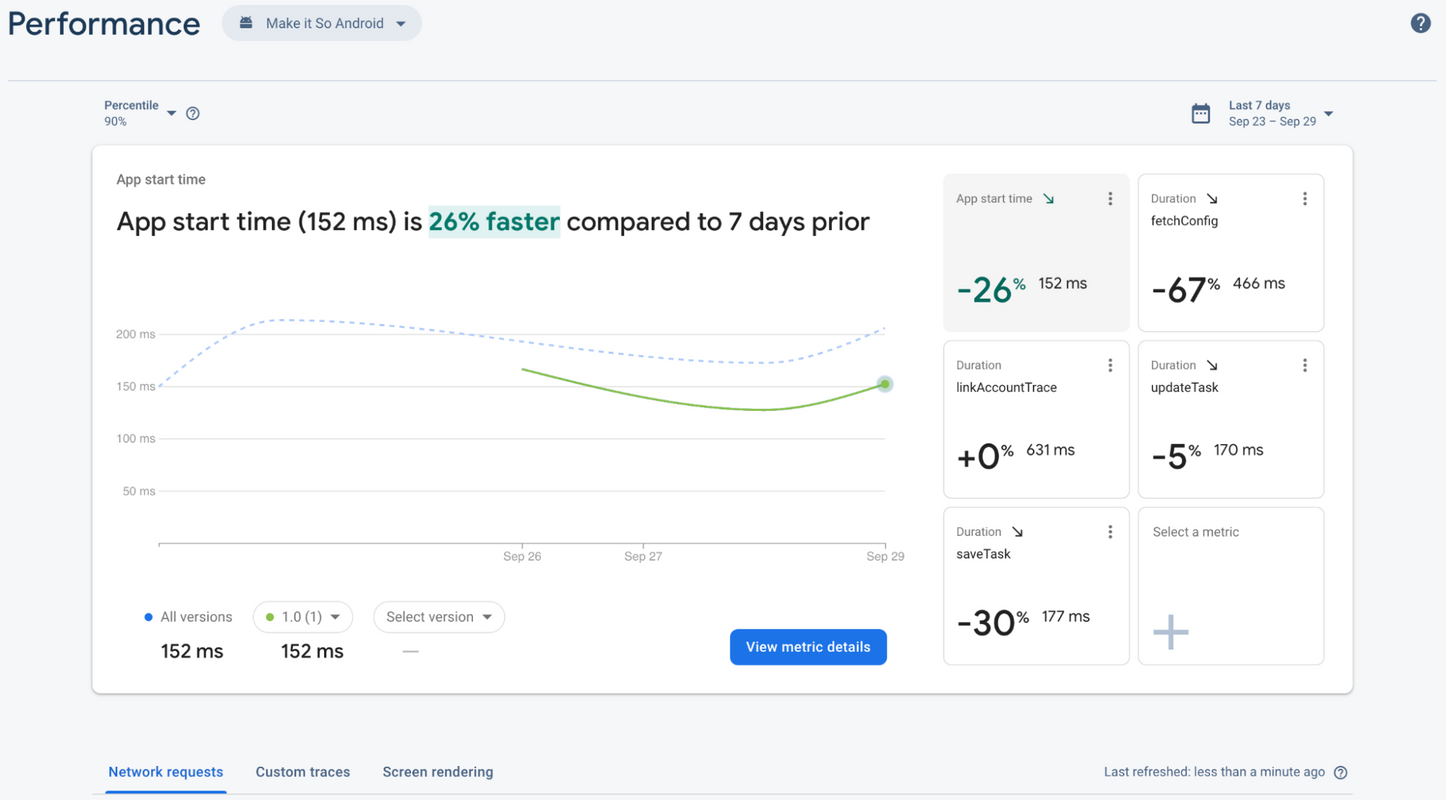
The metrics board shows collected metric data over time, both in graphical form and as a numerical percentage change. You can configure the right side of the dashboard to display the traces that are more important to you, so you can quickly access them when you open the Firebase console. If you have different versions of your app, you can view and compare one app version’s metric value to another app version or to all of your app versions. You can select the versions from the dropdowns below the chart.
Also, there are different colors that can be shown in the dashboard. Most metrics have a desired trending direction, so the metrics board uses color to indicate whether the metric’s data is trending in a positive or negative direction. If a metric doesn’t have a clear desired trending direction, like the response payload size for a network request, then the metrics board always displays the metric’s percentage change in gray.
Some traces shown in Fig. 1 are automatically collected when you run your app, like startup time, network request, and screen rendering. If your Android app is built with Activities and Fragments, you can benefit from automatic screen rendering collection, since they rely on the lifecycle of these classes. But this feature is not yet available for apps built with Jetpack Compose, since they usually have only one Activity. So let’s explore how you can create custom traces for specific parts of the code, to help you measure your screens’ performance when using Jetpack Compose for the UI, or measure business critical code paths.
Adding Performance Monitoring to your app
Add the SDK
To use Performance Monitoring, you first need to import the library to the app/build.gradle file:
dependencies {
    // Import the BoM for the Firebase platform
    implementation platform('com.google.firebase:firebase-bom:31.0.0')

    // Declare the dependency for the Performance Monitoring library
    implementation 'com.google.firebase:firebase-perf-ktx'
}
Next, add the Performance Monitoring Gradle plugin to the top of the same file:
apply plugin: 'com.google.firebase.firebase-perf'
Finally, add the Performance Monitoring Gradle plugin as a buildscript dependency in the project-level build.gradle file:
buildscript {
    repositories {
        google() // Check that you have Google's Maven repository
        mavenCentral() // Check that you have Maven Central repository
    }

    dependencies {
        // Check that you have the Google services Gradle plugin v4.3.2 or later
        classpath 'com.google.gms:google-services:4.3.14'

        // Add the Performance Monitoring Gradle plugin
        classpath 'com.google.firebase:perf-plugin:1.4.2'
    }
}
Done! All you need to do now is sync the project with the Gradle Files by clicking the File option from the top menu. Now, you are already benefiting from Performance Monitoring, because the automatic traces are being captured and displayed on the Firebase console.
Creating custom traces
The Firebase Performance Monitoring API provides a method Trace.create(String) to create custom traces. When you call this method, pass the name of the trace as a parameter. Once you create a new trace, you can measure any part of your codebase by starting and stopping the trace when the execution of this piece of code starts and ends. To start and stop the trace, use the start() and stop() methods that are available for each created trace.
Alternatively, in Make it So (the app used for this series), we created an inline function called trace(). This function calls the Performance Monitoring API to create a custom trace, also passing along the trace name as a parameter. The other parameter that you see in the snippet below is the block of code that you want to monitor. The default metric collected for each trace is the elapsed time that the trace takes to run from start to finish:
inline fun <T> trace(name: String, block: Trace.() -> T): T = Trace.create(name).trace(block)
Using custom traces
Now you can choose which parts of the codebase you want to measure. You can also add custom traces to the codebase using the trace() function shown in the Creating custom traces section above. Here’s an example of how to add a custom trace to a function from the authentication service (see in Adding Firebase Authentication to a Jetpack Compose app):
override suspend fun linkAccount(email: String, password: String): Unit =
  trace(LINK_ACCOUNT_TRACE) {
      val credential = EmailAuthProvider.getCredential(email, password)
      auth.currentUser!!.linkWithCredential(credential).await()
  }
The trace() function calls the start() and stop() methods automatically. The function understands that the piece of code you want to measure is the code contained inside the tracing block, so you don’t have to remember to do it yourself! Also, inside this block you have access to the trace object, so you can call ddAttribute and addMetric to attach custom data to this object.
Once you run your app and use the features you want to measure, go to the Performance dashboard in the Firebase console. There you will find three tabs: Network requests, Custom traces, and Screen rendering. Go to the Custom traces tab and check that the traces you added in the codebase are being displayed. You can also see how much time it typically takes to execute these pieces of code.
What’s next
In part 7 of this series, we’ll show you how to remotely control the behavior and appearance of your application using Firebase Remote Config, without having to ask users to download and install a new version of your application.
You can find and clone the source code in this Github repository - all the code you saw in this article is available in the v1 folder. If you’re interested in iOS/Mac development, the same application is available for these platforms, too. The iOS/Mac version of Make it So uses SwiftUI to build the user interface, following the declarative UI model that is similar to how we build UIs in Compose. You can find the source code in this Github repository.
If you have any questions or suggestions, feel free to reach out to us on the discussions page of the repository.