

Firebase A/B Testing helps you optimize your app by trying different user experiences to see if they improve your key metrics. Until recently, A/B Testing used Bayesian statistics powered by Google Optimize. With the announcement of Google Optimize sunset earlier this year, we decided to rethink our methodology to ensure we’re offering the best possible solution.
We’re pleased to announce that we’ll be replacing the previous Bayesian methodology for analyzing results with a new frequentist method. We believe this will provide more intuitive and verifiable inferences for your A/B tests.
We heard from many customers that the existing Bayesian inference feels like a “black box,” since it relies on a stochastic sampling approach which cannot be recreated independently on your own for deeper evaluation. The move to use the frequentist method means that you can independently verify the entire hypothesis testing procedure. We report on relevant input values like variant outcomes, users, and standard deviation in the Firebase console. You can use these values to verify p-values or generate additional statistics.
Another change you’ll notice is we no longer wait a set number of days to declare a leader. While it’s good practice to ensure you have achieved sufficient sample sizes and accounted for short-term effects, we’ll report the leading variant outcome as soon as we detect it.
How to interpret the new results
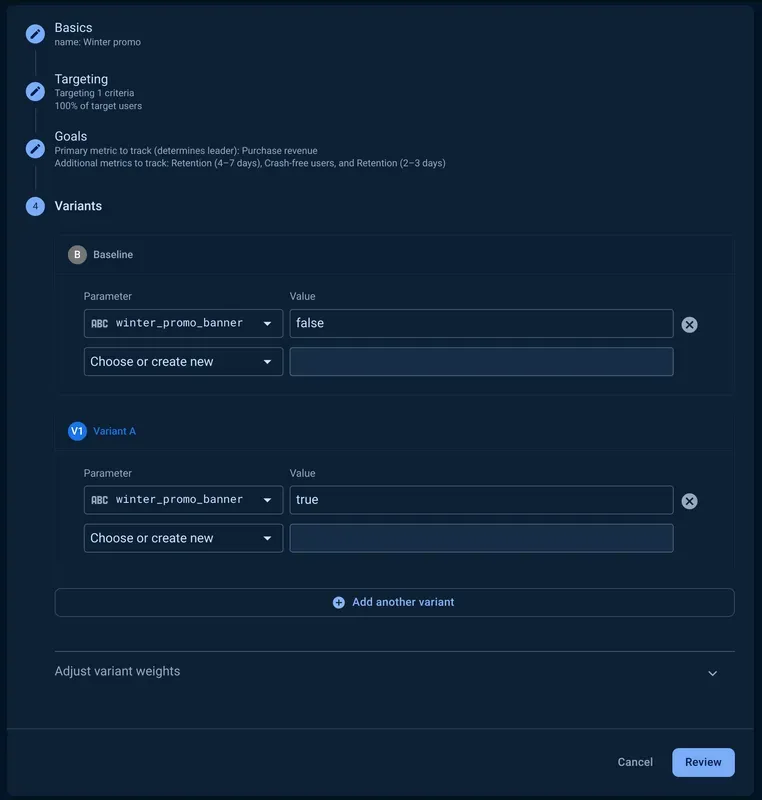
Let’s walk through an example. Say you want to increase your purchase revenue and are experimenting with a sales promotion. You create an A/B test with 2 variants: the baseline has no promotion; and the variant has the promotion. Your primary objective is to increase purchased revenue, and you also want to track crash-free users and retention to ensure the change doesn’t hurt your app’s stability or cause customers to churn.
After running for a few days, you come back to check on the results.
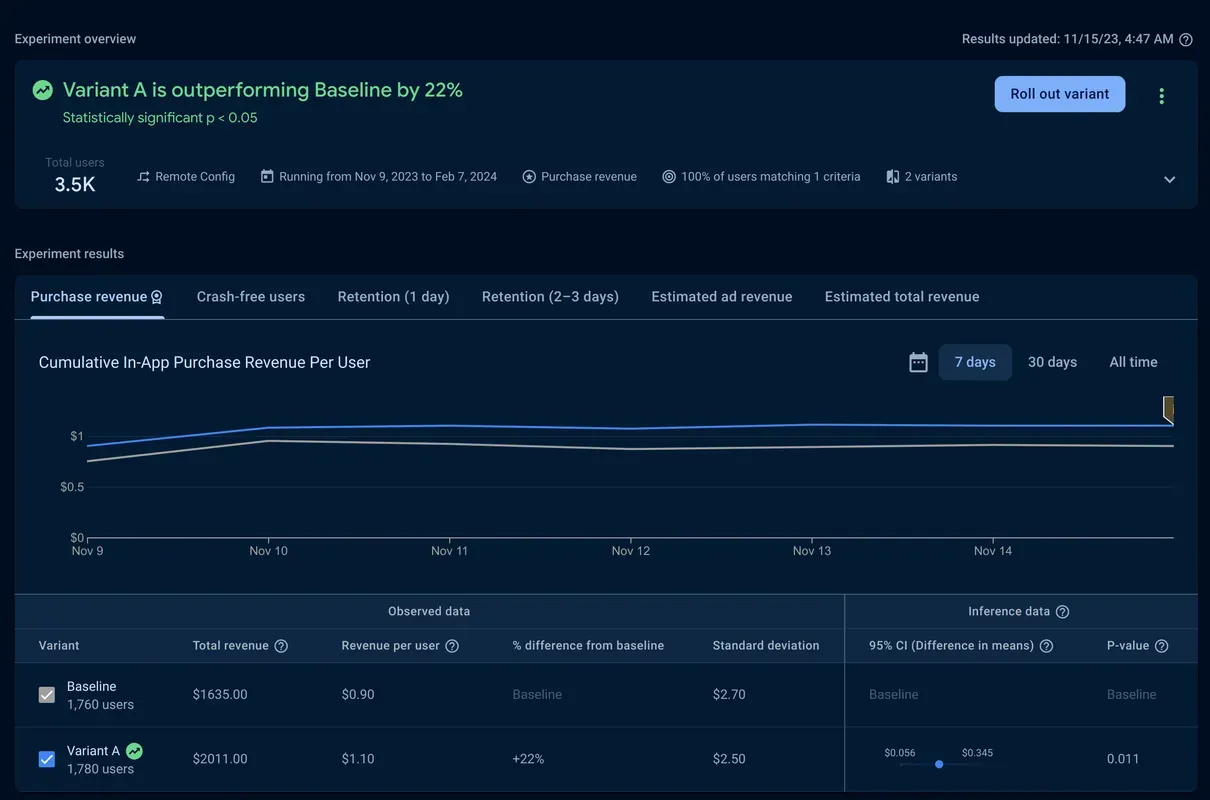
You can see that “Variant A is outperforming Baseline by 22%” and it is statistically significant at the 95% confidence level because the p-value of 0.011 is less than 0.05. This means the lift was unlikely to have occurred by random chance. And, with double the purchase revenue, this is a meaningful lift.
You next take a look at the confidence interval of difference of means. For Variant A, there’s an increase in average revenue from $0.90 to $1.10.
The confidence interval provides the range of expected lift values, at the 95% confidence level. In other words, the lower value is the “worst case” scenario of possible lift and the higher value is the “best case” scenario. Here, you see a range from $0.056 per user to $0.345. Both values are a nice improvement, so based on this, you can feel confident about the change.
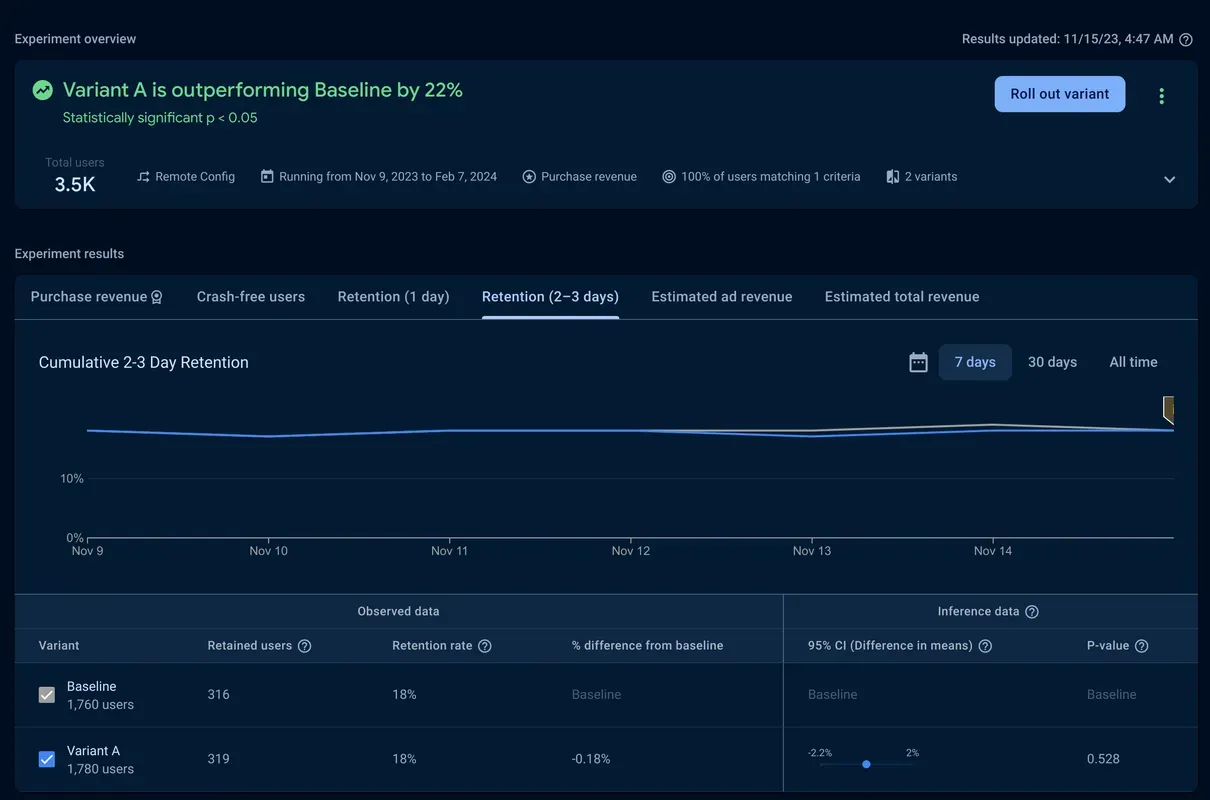
Next, you check in on the secondary objectives.
For retention, there’s a slight reduction of .18%, but with a p-value of 0.528, it’s not significant.
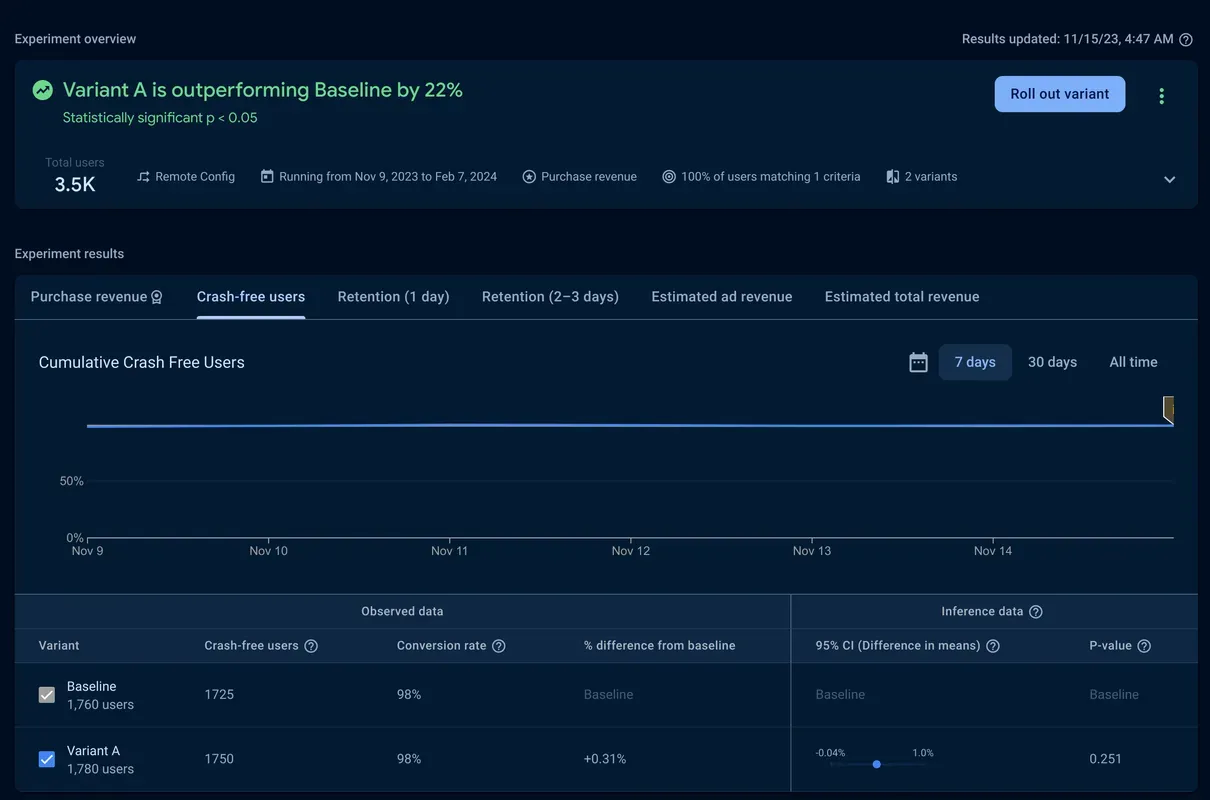
Crash-free users held steady at 98% and also had a non-significant p-value.
With a significant lift in purchase revenue and no meaningful change in stability and retention, you can have high confidence in the change and you’re ready to roll the promotion out to your entire audience.
What about existing experiments?
To ensure continuity of existing experiments results that rely on Bayesian inference, only newly started experiments will use frequentist inference. Existing running experiments will continue to run on Bayesian until completion, and we’ll continue to display the Bayesian-based results on all completed experiments that ran on Bayesian.
Getting started
Now that frequentist inference is now available, you can try it out on your app. Check it out in the Firebase console today or learn more about A/B testing in our documentation.