

Rolling out a new version of your mobile app to production is one of the most exciting parts of app development, but it can also be one of the most stressful! Your team needs to keep track of version uptake, new bugs and the impact of those bugs, a comparison to earlier releases, and more.
What if you had one place to monitor – in real time – all the data you needed to feel confident about your release?
Meet the new Release Monitoring dashboard (Beta)
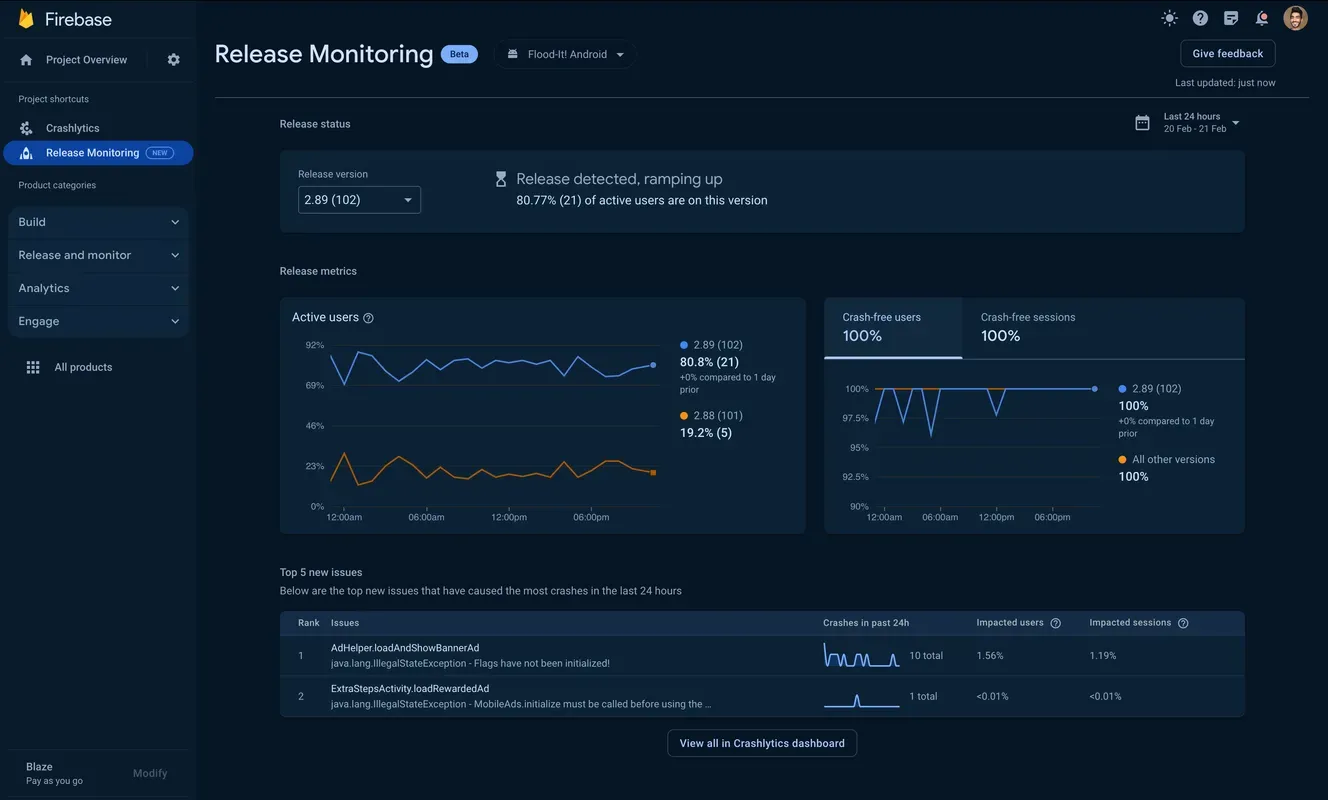
We’re introducing the Release Monitoring dashboard in the Firebase console. It’s a single dashboard to monitor your most recent production releases – updating in real time – to give you a high-level view of the most important release metrics. And it’s all powered by Firebase Crashlytics.
This new experience improves upon the Latest Release page in the console. Compared to that page, it adds more information, displays useful data without the need for Google Analytics, and loads more quickly.
What can you expect?
Real time reporting
In the dashboard, all the charts update in real time.
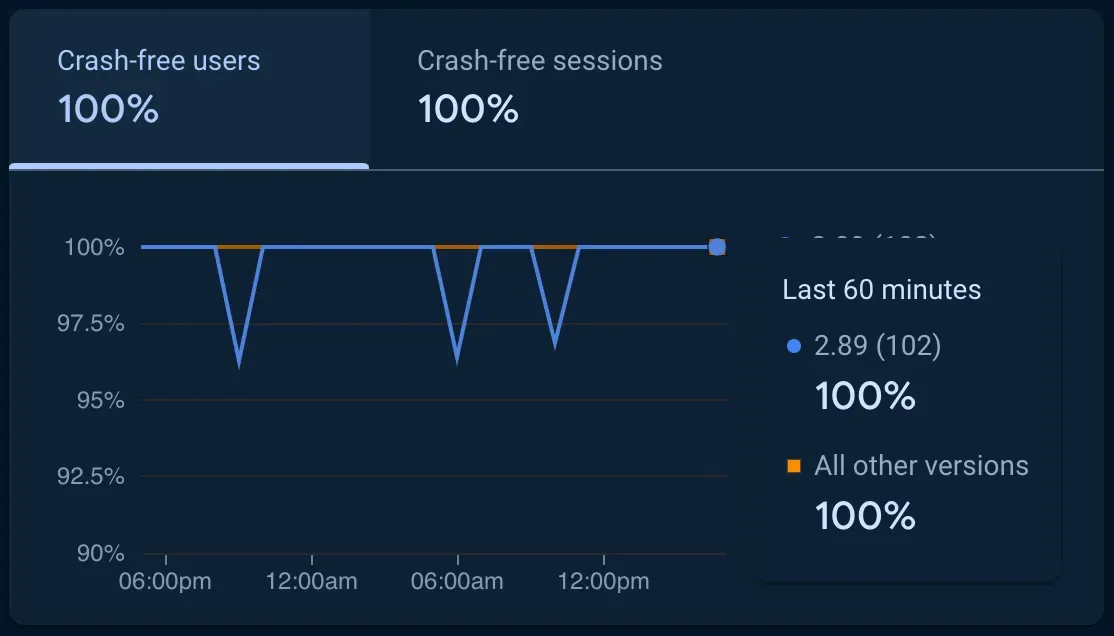
Shortly after you deploy your latest version, you can watch as users start engaging with that release and hopefully enjoy the new features that your team has built for them. If some of those users happen to experience crashes, you’ll know the impact immediately through the expanded crash-free metrics charts.
And since while we’re talking about crash-free metrics, you’ll notice a new metric – crash-free sessions! Sessions without crashes indicate overall reliability of an app and build user confidence. Tracking crash-free sessions is especially important in the early stages of a new release, when a crash during a user’s first interaction could result in immediate frustration to the point of abandonment.
Comparisons and benchmarking based on your previous releases
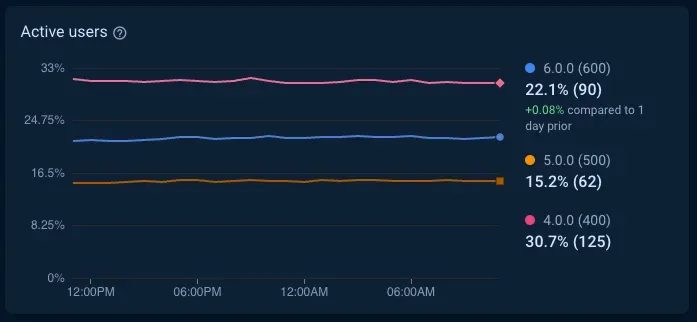
We’ve heard from many of you that, in addition to your latest version’s raw metrics, it’s just as important to see its stability in context. To help you with this, the dashboard lets you compare the live metrics from your latest release and up to two of your previously released builds.
Top new issues
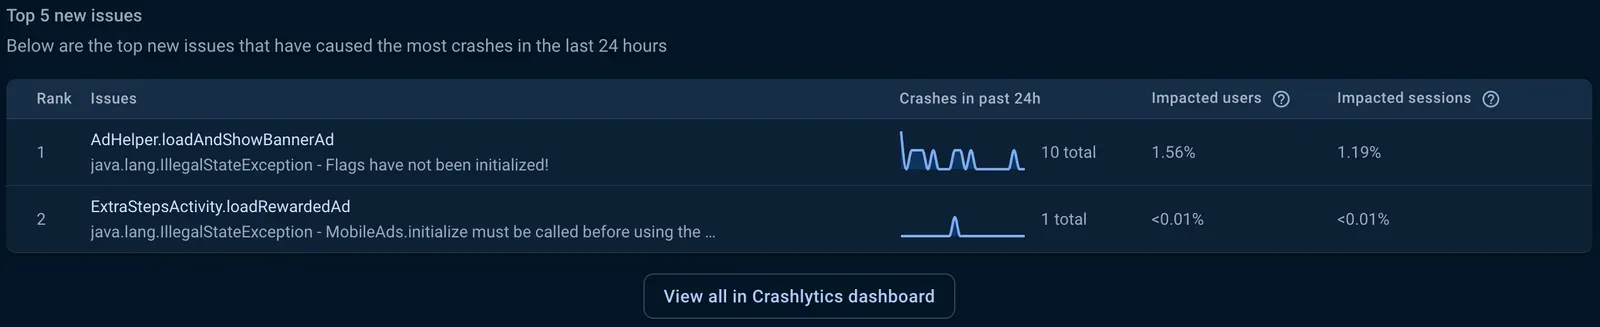
In addition to displaying version uptake and crash-free metrics, the dashboard also has a space to display new crashes as they arrive. In the “Top new issues” table, you can monitor the impact of the issues first detected in your latest release, allowing you to quickly make a decision on whether to halt or rollback the release.
Try it with your next release
Here’s how you can start using the Release Monitoring dashboard:
- Make sure your app uses at minimum the following versions of the Crashlytics SDK:
Apple platforms: v10.8.0+ | Android: v18.6.0+ (BoM v32.6.0+) | Flutter: v3.4.5+ | Unity: v11.7.0+ - Publish a new version of the app to production and have a sufficient number of engaged users.
- Open the Release Monitoring dashboard in the Firebase console and see your new data arriving in real time! :)
We’re hoping this new dashboard helps you:
- Release new versions/features of your mobile apps to production safer and easier than ever before.
- Adopt DevOps best practices like progressive rollouts, halting releases, triaging anomalies in real time, and error alerting.
Want to learn more? Check out Monitor the stability of your latest app release in the Firebase documentation.